Flags and pennants.
A flag is a short, narrow channel that slopes against a sharp price move, called the pole. A pennant is the same pause shaped like a small triangle. Traders read both as a rest before the move continues. A common plan trades the break in the pole's direction and projects the pole's length as a rough target.
Ce contenu n'existe pour l'instant qu'en anglais.
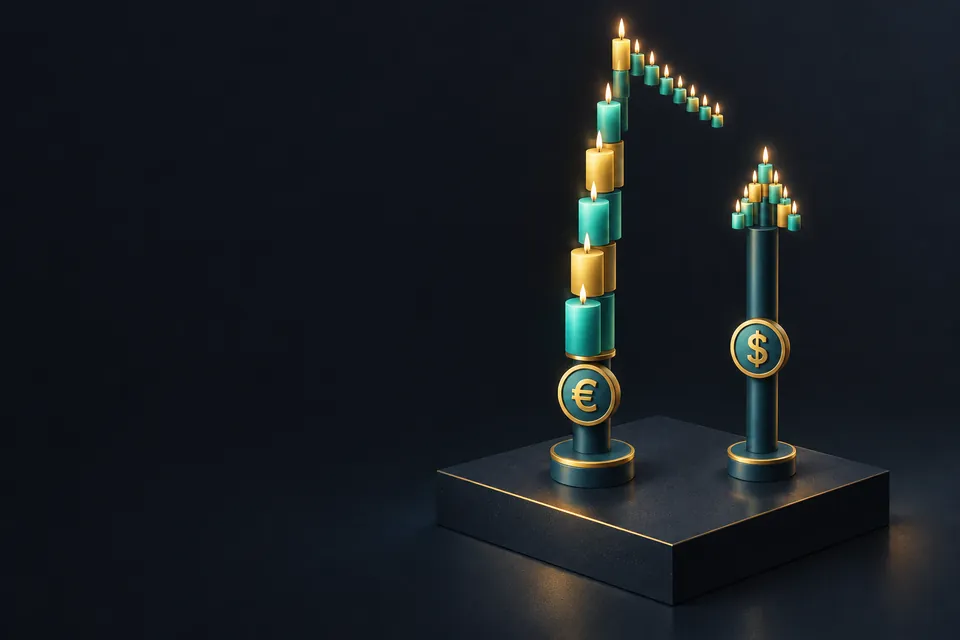
Picture EUR/USD jumping 80 pips in a couple of hours, then drifting a little lower in a tight, orderly channel. That quiet drift after a burst is the shape chartists call a flag.
A pennant is its close cousin, with a small triangle in place of the channel. Both are continuation patterns, read as a pause before the earlier move resumes.
What does a flag look like on a chart?
A flag has two parts. First comes the pole, a fast, almost straight move in one direction. Then comes the flag, a short pause where price moves inside two roughly parallel lines that tilt against the pole.
In a bull flag the pole rises and the flag slopes gently down. In a bear flag the pole falls and the flag slopes gently up.
Take the EUR/USD move from the opening, with round illustrative prices. Price rises from 1.08000 to 1.08800, an 80 pip pole.
It then drifts down in a narrow channel to a low of 1.08500. Later a candle closes above the upper line at 1.08650.
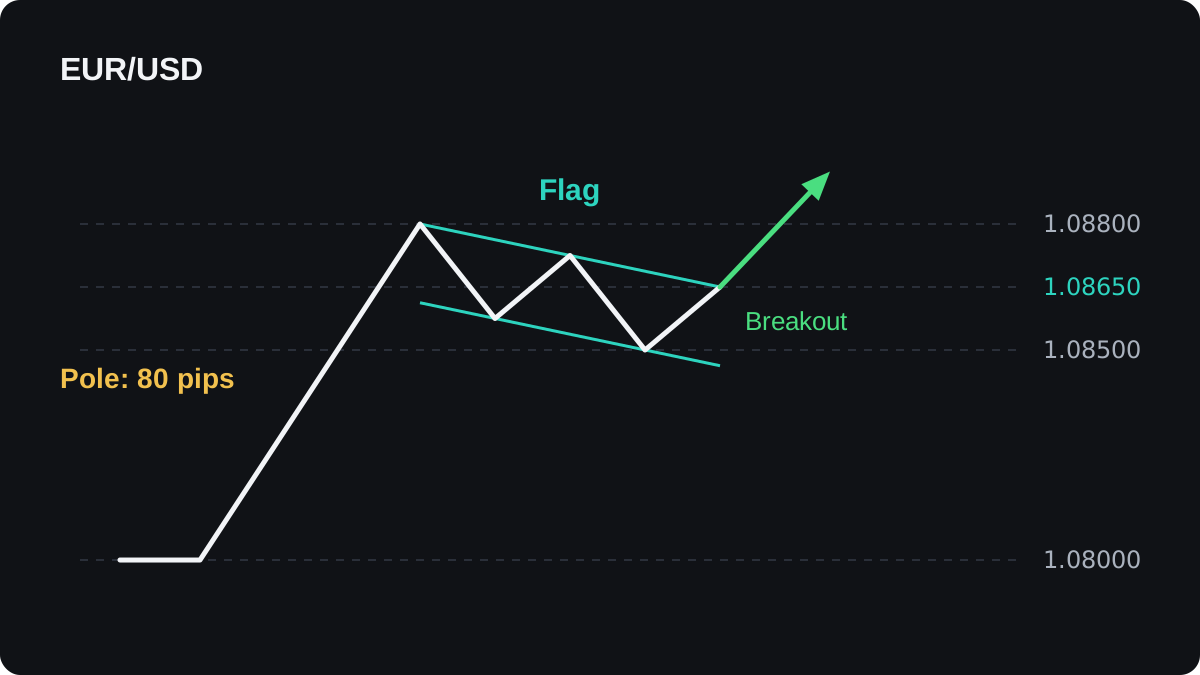
The flag gave back 30 pips of an 80 pip pole, which is 37.5%. A common rule of thumb says a flag should retrace less than about half the pole. A deeper pullback looks more like an ordinary correction than a pause.
The pause should also be short compared with the pole. If the channel drags on for far longer than the pole took to form, the burst of momentum that defined the pattern has faded.
How is a pennant different from a flag?
A pennant has the same pole, but the pause is a small triangle. Its upper line slopes down and its lower line slopes up, so the swings shrink until price breaks out.
It looks like a tiny symmetrical triangle, the shape from the triangle patterns lesson. What makes it a pennant is its small size and its place straight after a sharp pole.
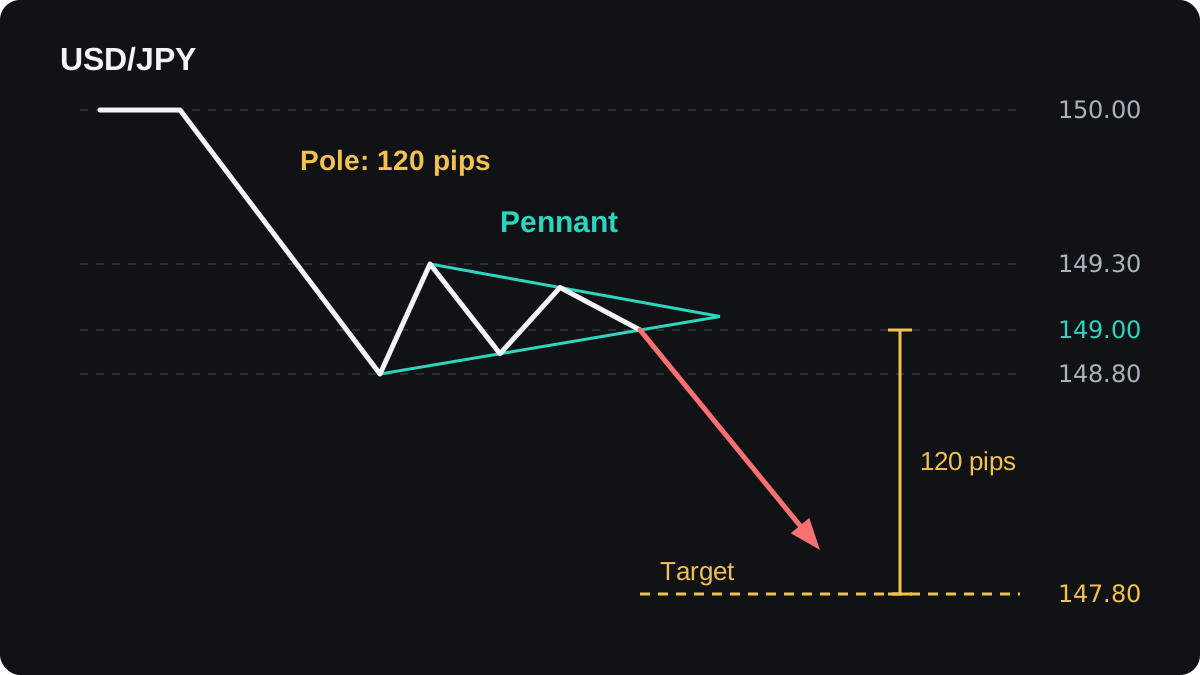
Here is a bear pennant on USD/JPY, where a pip is 0.01. Price falls from 150.00 to 148.80, a pole of 1.20 yen, or 120 pips. It bounces to 149.30, which retraces 50 of the 120 pips, then squeezes into a narrowing range.
The breakout comes when price falls through the rising lower line at 149.00. Projecting the 120 pip pole down from there gives 149.00 minus 1.20 = 147.80.
How do you tell a flag from similar patterns?
Several patterns share parts of this shape. The first test is the pole: without a sharp, fast move before it, a small channel is just a channel.
Slope separates a flag from a wedge. A flag's lines run roughly parallel, while a wedge's lines converge and both point the same way.
A rectangle has flat, horizontal boundaries and can last much longer. A flag usually tilts against the pole and stays small compared with it.
Volume is the classic extra check: heavy during the pole, lighter in the flag, heavier again at the breakout.
Spot forex has no central exchange, so your platform shows tick volume, the count of price changes in each candle. It is only a rough stand-in for real trading volume.
How do traders enter, place a stop and set a target?
A typical plan waits for a break of the flag line in the pole's direction. Some traders enter as soon as price crosses the line.
Others wait for a candle to close beyond it. That filters out some quick fake moves, often at the cost of a worse entry price.
The stop usually goes just beyond the far side of the pattern: below the flag's low in a bull flag, above its high in a bear flag. If price gets back there, the pause has turned into something else.
The usual target is the measured move: take the length of the pole and add it to the breakout price, or subtract it for a bear pattern. That is where the 147.80 on the USD/JPY chart came from.
Chartists do not agree on exactly where a pole starts, so two people can draw different targets from the same chart. Treat the measured move as a rough guide, with no promise that price gets there.
A worked bull flag trade on EUR/USD
The prices are round and illustrative. The plan uses the flag from the first chart, a $5,000 account in US dollars and a risk of 1% per trade. The 1% is only an example.
- Measure the pole: 1.08800 minus 1.08000 = 0.00800, which is 80 pips.
- Check the flag: its low is 1.08500, so it gave back 30 of the 80 pips, or 37.5%.
- Enter: a candle closes above the upper line and you buy at 1.08650.
- Place the stop 5 pips under the flag low, at 1.08450. The risk is 1.08650 minus 1.08450 = 0.00200, or 20 pips.
- Set the target: 1.08650 plus 0.00800 = 1.09450, which is 80 pips above the entry.
- Size the trade: 1% of $5,000 is $50, and $50 ÷ 20 pips = $2.50 per pip. One standard lot of EUR/USD is worth $10 per pip, so $2.50 ÷ $10 = 0.25 lot.
- Check both outcomes: at the target you gain 80 × $2.50 = $200, and at the stop you lose 20 × $2.50 = $50.
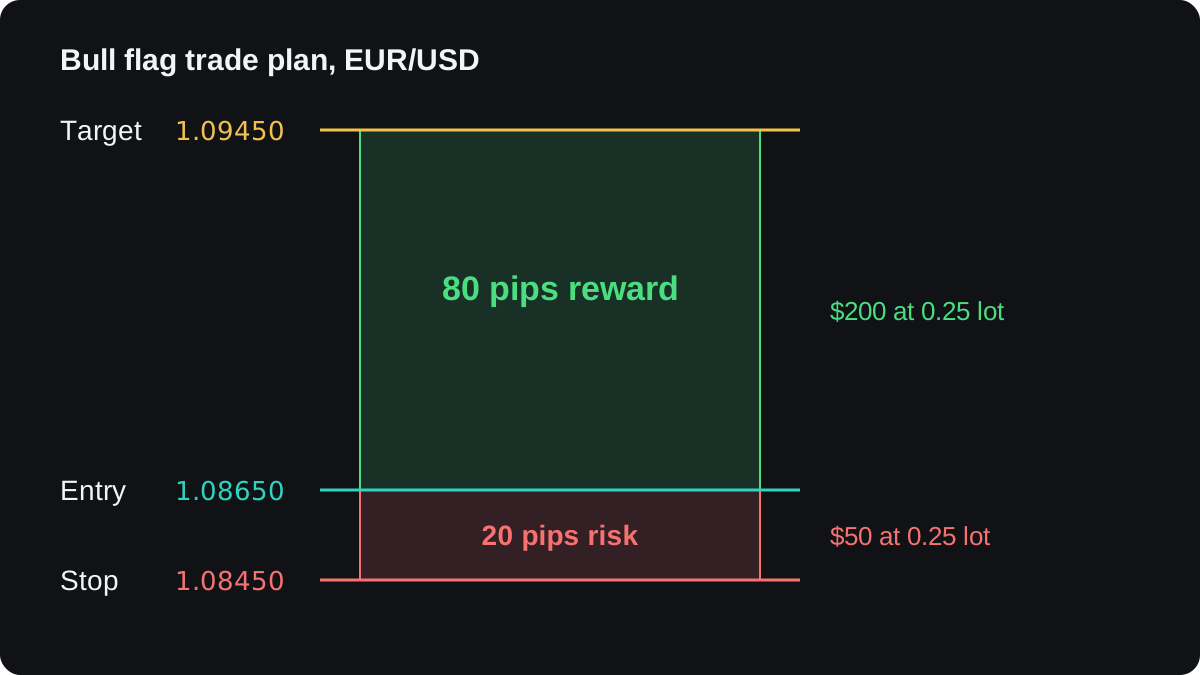
Those results leave out the spread, any commission and slippage, which all make the real numbers slightly worse. The position size lesson explains step 6 in depth, and the lot size calculator does it for any pair.
The plan offers 80 pips of reward for 20 pips of risk, or 4 to 1. That ratio says nothing about how often the target is reached, which is why risk-reward and win rate have to be judged together.
Where do flags and pennants fail?
The most common failure is a breakout that does not hold. Price pokes through the flag line, closes back inside, and the stop is hit. The false breakouts lesson looks at how traders handle them.
A flag can also keep sinking until it retraces most of the pole. At that point the pattern is gone, and the trend itself may be turning.
Poles built by a single news release need extra care. The spike may reflect one surprise figure, and it can reverse once the market digests the news. Spreads are often wider around big releases too.
Spotting flags is subjective. Two traders can look at the same candles and disagree on whether a flag exists, where its lines go and where the pole began. That makes the pattern hard to test fairly.
Published testing of chart patterns gives mixed results, and an edge found in one market or period can fade in another.
If you want to use flags, write precise rules for the pole, the flag and the breakout. Then test them on past data and a demo account before risking money.
Questions fréquentes
Is a bull flag bullish?
It is read as a sign that an uptrend may continue after a pause. Some bull flags break down instead, so traders wait for the breakout and keep a stop below the flag low.
What is the difference between a flag and a pennant?
Both follow a sharp pole. A flag's pause is a small channel with roughly parallel lines, and a pennant's pause is a small triangle with converging lines.
How do you calculate a flag's target?
Measure the pole in pips and add it to the breakout price for a bull flag, or subtract it for a bear flag. An 80 pip pole broken at 1.08650 points to 1.09450.
How long does a flag pattern last?
There is no fixed length. The pause should be short compared with the pole, and a flag that drags on far longer than the pole took to form has lost the momentum that defined it.
Can you trade flags on any timeframe?
The shape appears on charts from one minute to weekly. Shorter charts show more of them along with more noise, and the spread takes a bigger share of a small target.
Continuer à apprendre
 Chapitre 2Head and shoulders.A head and shoulders is a chart pattern of three peaks, with the middle one highest, that can mark the end of an uptrend. The neckline joins the two lows between the peaks. Traders treat a close below it as the trigger and measure a target by projecting the head's height down from the break.
 Chapitre 2Double tops and double bottoms.A double top is two peaks at about the same price with a dip between them; a double bottom is two lows with a bounce between. The low or high between them is the neckline. The pattern only counts once price closes beyond the neckline, and it can still fail after that.
 Chapitre 2Ascending, descending and symmetrical triangles.A triangle is a pattern where price swings narrow between two converging trend lines. An ascending triangle has a flat top and rising lows, a descending triangle a flat bottom and falling highs, and a symmetrical triangle slopes on both sides. Each can break either way, so a common rule is to wait for a close outside the lines.
 Chapitre 2Rising and falling wedges.A wedge is a chart pattern where price swings between two trend lines that slope the same way and move closer together. A rising wedge slopes up and is usually read as bearish. A falling wedge slopes down and is usually read as bullish. Neither is reliable on its own, so traders wait for a confirmed break.
 Chapitre 2Rectangles.A rectangle is a sideways range where price bounces between two flat levels, resistance above and support below. It ends when price closes outside the box. Traders often sketch a target by adding the box's height to the broken level, but a rectangle can break either way and the break can fail.
 Chapitre 2Chart patterns cheat sheet.Most chart patterns share one set of rules. Enter when a candle closes beyond the pattern's boundary, put the stop beyond the opposite side or the last swing, and aim for the pattern's height projected from the breakout, or the pole's length for flags and pennants. This sheet gives each pattern's entry, stop and target.
Courtiers partenaires

