Reading trends with Heikin Ashi.
On a Heikin Ashi chart, a strong uptrend shows as a run of green candles with no lower wick, and a strong downtrend as red candles with no upper wick. Shrinking bodies with wicks on both sides warn that the move may be slowing. Colour changes come late, because each candle's open is built from the candle before.
Ce contenu n'existe pour l'instant qu'en anglais.
On a Heikin Ashi chart, a trend shows up as a run of candles in one colour. The shape of each candle adds detail: whether a wick is missing on one side, and whether the body is growing or shrinking.
This lesson reads those shapes on four example candles. If you have not yet seen how the candles are built, start with what Heikin Ashi candles are.
What does a trend look like on a Heikin Ashi chart?
In a steady uptrend you tend to see green candle after green candle, many of them with no lower wick. In a steady downtrend the candles are red, and many have no upper wick.
When a move loses pace, the bodies shrink and wicks appear on both sides. A change of colour often follows, though a trend can also pause and then carry on.
Colour runs usually last longer here than on a regular candlestick chart. Each Heikin Ashi candle opens at the midpoint of the previous body, so it carries part of the earlier move with it.
That makes a trend easier to see at a glance. The same averaging also makes the colour flip later than the market does.
Working through four Heikin Ashi candles
The four rules from the previous lesson are:
- HA close = (open + high + low + close) ÷ 4
- HA open = (previous HA open + previous HA close) ÷ 2
- HA high = the highest of the high, the HA open and the HA close
- HA low = the lowest of the low, the HA open and the HA close
Here are four regular EUR/USD candles with round illustrative prices. The Heikin Ashi candle before them opened at 1.08000 and closed at 1.08200.
| Candle | Open | High | Low | Close |
|---|---|---|---|---|
| 1 | 1.08200 | 1.08500 | 1.08180 | 1.08440 |
| 2 | 1.08440 | 1.08700 | 1.08420 | 1.08660 |
| 3 | 1.08660 | 1.08680 | 1.08340 | 1.08420 |
| 4 | 1.08420 | 1.08440 | 1.08300 | 1.08320 |
Candle 1, step by step:
- HA close = (1.08200 + 1.08500 + 1.08180 + 1.08440) ÷ 4 = 4.33320 ÷ 4 = 1.08330.
- HA open = (1.08000 + 1.08200) ÷ 2 = 1.08100.
- HA high = the highest of 1.08500, 1.08100 and 1.08330, which is 1.08500.
- HA low = the lowest of 1.08180, 1.08100 and 1.08330, which is 1.08100.
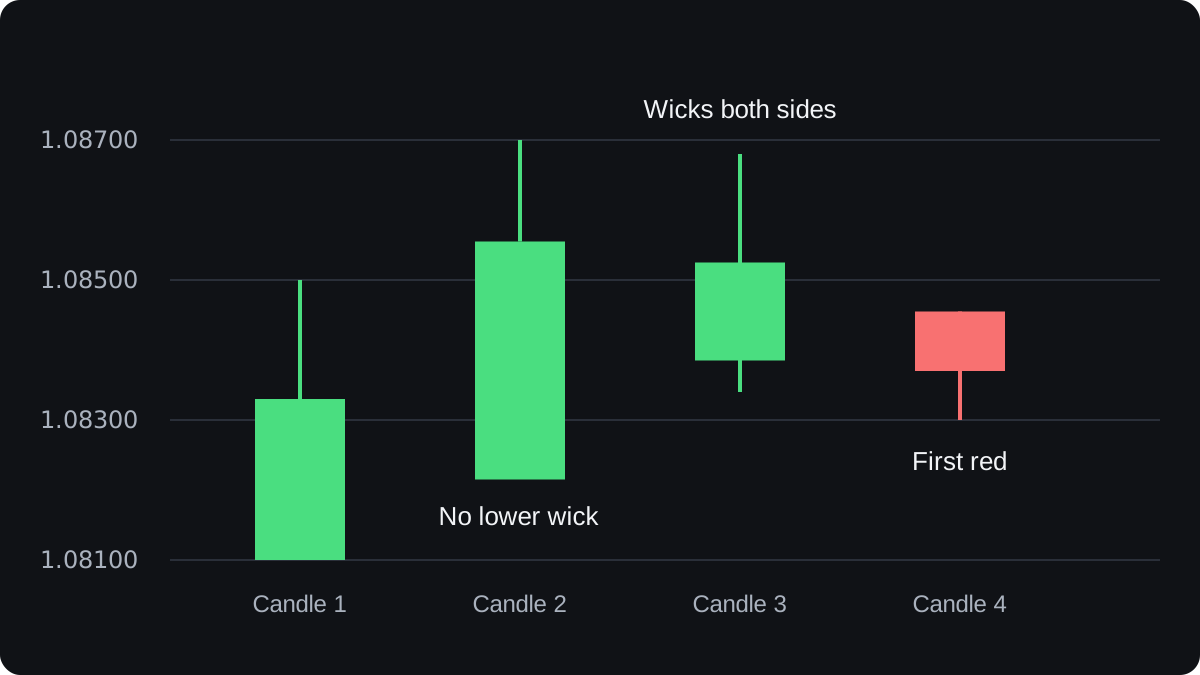
The HA close is above the HA open, so the candle is green. Its low equals its open, so it has no lower wick.
The same steps give the other three candles. Each new HA open uses the HA open and HA close from the row above.
| Candle | HA open | HA close | HA high | HA low | Colour |
|---|---|---|---|---|---|
| 1 | 1.08100 | 1.08330 | 1.08500 | 1.08100 | Green |
| 2 | 1.08215 | 1.08555 | 1.08700 | 1.08215 | Green |
| 3 | 1.08385 | 1.08525 | 1.08680 | 1.08340 | Green |
| 4 | 1.08455 | 1.08370 | 1.08455 | 1.08300 | Red |
What does a missing wick tell you?
A green Heikin Ashi candle has no lower wick when its HA low equals its HA open. That happens when the regular low stays at or above the HA open, the midpoint of the previous Heikin Ashi body.
In candle 2 the regular low was 1.08420, well above the HA open of 1.08215. The HA low is therefore 1.08215, the same as the open, and the candle has no lower wick.
In candle 3 the regular low fell to 1.08340, below the HA open of 1.08385. The lower wick is 1.08385 − 1.08340 = 0.00045, which is 4.5 pips.
Red candles follow the mirror rule: no upper wick when the regular high stays at or below the HA open. In candle 4 the high of 1.08440 stayed below the HA open of 1.08455, so there is no upper wick.
In plain terms, a missing wick means price never pulled back past the middle of the previous candle. It describes the period that has just closed and makes no promise about the next one.
What do small bodies and long wicks warn you about?
Body size is the gap between the HA open and the HA close. Candle 1 measures 1.08330 − 1.08100 = 0.00230, or 23 pips. Candle 2 grows to 34 pips, then candle 3 drops to 14 and candle 4 to 8.5.
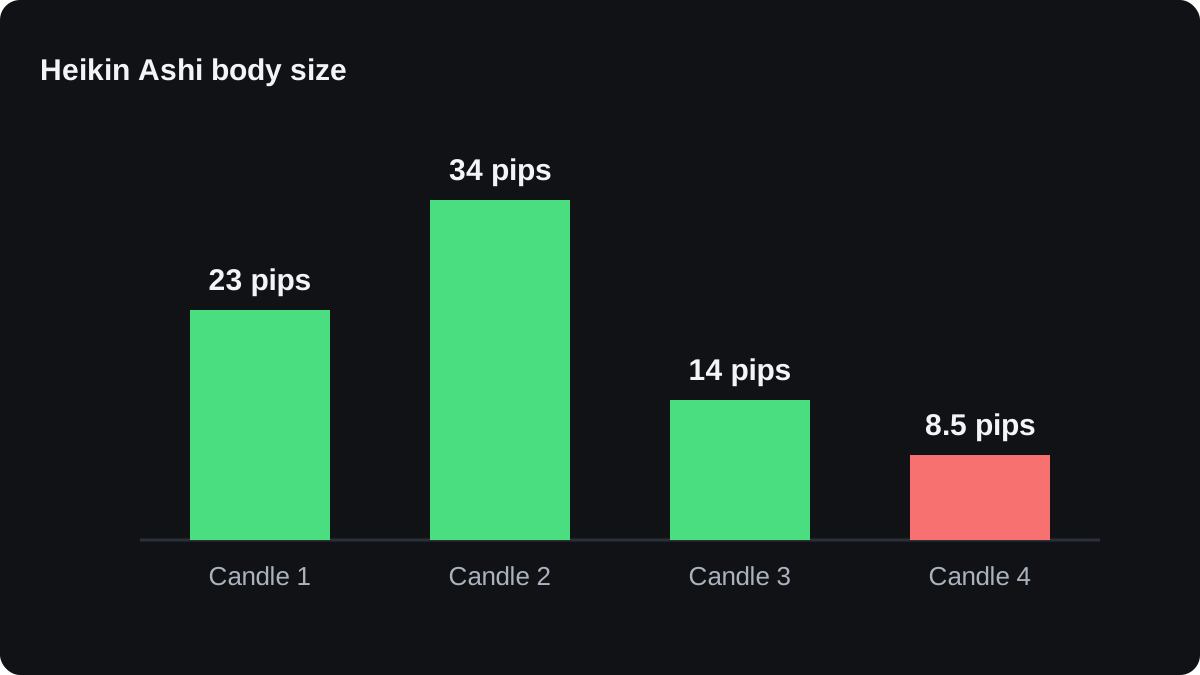
Candle 3 is still green, but its body is less than half the size of candle 2. It also has wicks on both sides: 15.5 pips above (1.08680 − 1.08525) and 4.5 pips below.
A small body with wicks on both sides suggests that neither buyers nor sellers controlled the period. On a regular chart the same idea appears as a spinning top or a doji.
This shape often forms near turns. It also forms during pauses inside a trend that later resumes, so on its own it tells you the push has slowed and says nothing about the direction of the next move.
Why does the colour change come late?
Regular candle 3 opened at 1.08660 and closed at 1.08420, a red candle that fell 24 pips. The Heikin Ashi candle for the same period stayed green, because its open of 1.08385 still carried the earlier rise.
The first red Heikin Ashi candle came one period later, on candle 4. By then the regular close had fallen from 1.08660 at candle 2 to 1.08320 at candle 4, a drop of 34 pips.
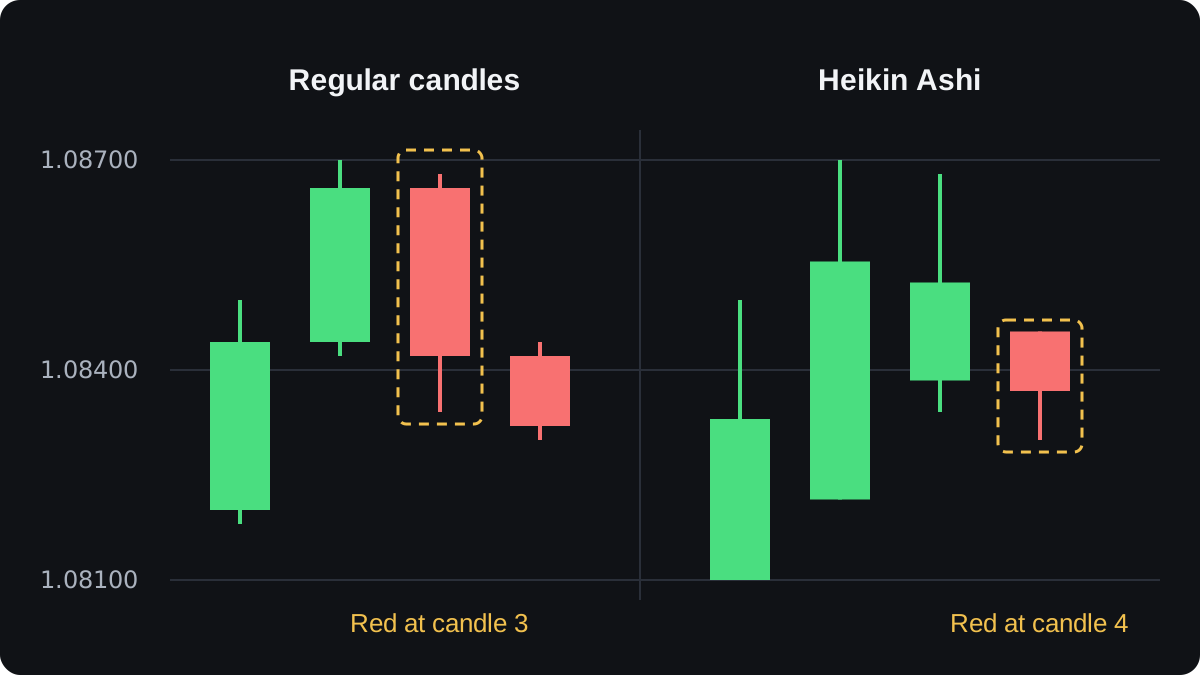
The smoothing that removes small colour flips also delays the real ones. On a fast reversal, that lag can cover a large part of the move before the first red candle closes.
The HA close is an average, so nobody traded at it. The real close of candle 4 was 1.08320, while its HA close was 1.08370.
Orders fill at real bid and ask prices. The Heikin Ashi limitations lesson covers what that means for entries and stops.
How can you use these clues without trusting them too much?
The clues carry the most information when there is a trend to read. In a sideways market the colours flip often and small bodies are everywhere, so first check whether the market is trending or ranging.
Location matters as well. A shrinking body that forms near support or resistance tells you more than one that forms far from any level.
A higher timeframe puts a run in context. Three red candles on a 15-minute chart may be a small dip inside a green run on the 4-hour chart, which is one reason to use more than one timeframe.
Any rule built on these clues, such as holding a buy until two red candles close, is an untested idea. That rule is an example only. You can backtest it on past data, with spread costs included, before relying on it.
This lesson has no tested figure for how often Heikin Ashi colour rules beat chance. Results depend on the pair, the timeframe and the exact rule, so treat any claim that they reliably work with caution.
Questions fréquentes
What does a Heikin Ashi candle with no lower wick mean?
It is a green candle whose low equals its open, because price never traded below the midpoint of the previous Heikin Ashi body. It often appears in a steady uptrend, but it describes the past period only.
How many Heikin Ashi candles confirm a trend change?
There is no fixed number. Waiting for two or three candles of the new colour filters out more false flips but reacts later, so the choice is a trade-off you can test on past data.
Is a Heikin Ashi colour change a reversal signal?
It shows that the averaged price has turned, which usually happens after the regular chart has already turned. In a sideways market it happens often without any lasting reversal.
Can you use Heikin Ashi prices for entries and stop losses?
Use real prices for orders. The HA open and HA close are calculated values, so read the regular chart or your platform's bid and ask before you place an entry or a stop.
Continuer à apprendre
 Chapitre 1What are Heikin Ashi candles?Heikin Ashi candles are built from averaged prices. Each close is the average of the period's open, high, low and close, and each open is the midpoint of the previous Heikin Ashi body. The chart comes out smoother, so trends are easier to see, but its candles do not show where price actually opened and closed.
 Chapitre 1Heikin Ashi limitations.Heikin Ashi candles are built from averages, so their open and close are calculated values that need not match any price traded at that moment, and a wick can reach a price that never traded in that period. They are slow to show reversals. Take entries, stops and backtest fills from a normal candlestick chart.
Courtiers partenaires

