Chart patterns cheat sheet.
Most chart patterns share one set of rules. Enter when a candle closes beyond the pattern's boundary, put the stop beyond the opposite side or the last swing, and aim for the pattern's height projected from the breakout, or the pole's length for flags and pennants. This sheet gives each pattern's entry, stop and target.
هذا المحتوى متاح حاليًا باللغة الإنجليزية فقط.

This sheet lists the entry, stop and target for every pattern in this chapter, with two worked examples. The rules are common textbook conventions, and many traders adjust them.
The rules most patterns share
Most patterns have a boundary: a neckline, trend line or range edge. Enter when a candle closes beyond it; a wick that closes back inside does not count.
The stop goes where the pattern is proven wrong, usually beyond the opposite side or the last swing inside it.
The target is a measured move: the pattern's height projected from the breakout, or the pole's length for flags and pennants.
Waiting for a retest of the broken boundary gives a better price, but some breakouts never come back.
Entry, stop and target for each pattern
A head and shoulders top and a double top warn that a rise may end; inverse forms appear after a fall. Triangles and rectangles can break either way.
Wedges slope against their expected break: a rising wedge is read as bearish and a falling wedge as bullish.
Flags and pennants are short pauses after a sharp move called the pole.
| Pattern | Close to enter | Stop | Target |
|---|---|---|---|
| Head and shoulders top | Below neckline | Above right shoulder | Head to neckline, down |
| Inverse head and shoulders | Above neckline | Below right shoulder | Head to neckline, up |
| Double top | Below neckline | Above higher peak | Peak to neckline, down |
| Double bottom | Above neckline | Below lower low | Low to neckline, up |
| Ascending triangle | Above flat top | Below last higher low | Height at start |
| Descending triangle | Below flat bottom | Above last lower high | Height at start |
| Symmetrical triangle | Beyond either line | Beyond last swing opposite | Height at start |
| Rising wedge | Below lower line | Above last swing high | Wedge start or height at start |
| Falling wedge | Above upper line | Below last swing low | Wedge start or height at start |
| Rectangle | Beyond either edge | Middle or far side | Range height |
| Bull flag | Above flag | Below flag low | Pole length |
| Bear flag | Below flag | Above flag high | Pole length |
| Pennant | Beyond, in pole's direction | Beyond other side | Pole length |
Worked example: a USD/JPY bull flag
Prices are round and illustrative. A pip on USD/JPY is 0.01.
- The pole runs from 150.00 to 151.50, which is 150 pips.
- A candle closes above the flag at 151.30, and you buy.
- The stop is 10 pips below the 151.00 flag low, at 150.90, a risk of 40 pips.
- The target is 151.30 + 1.50 = 152.80, 150 pips above the entry.
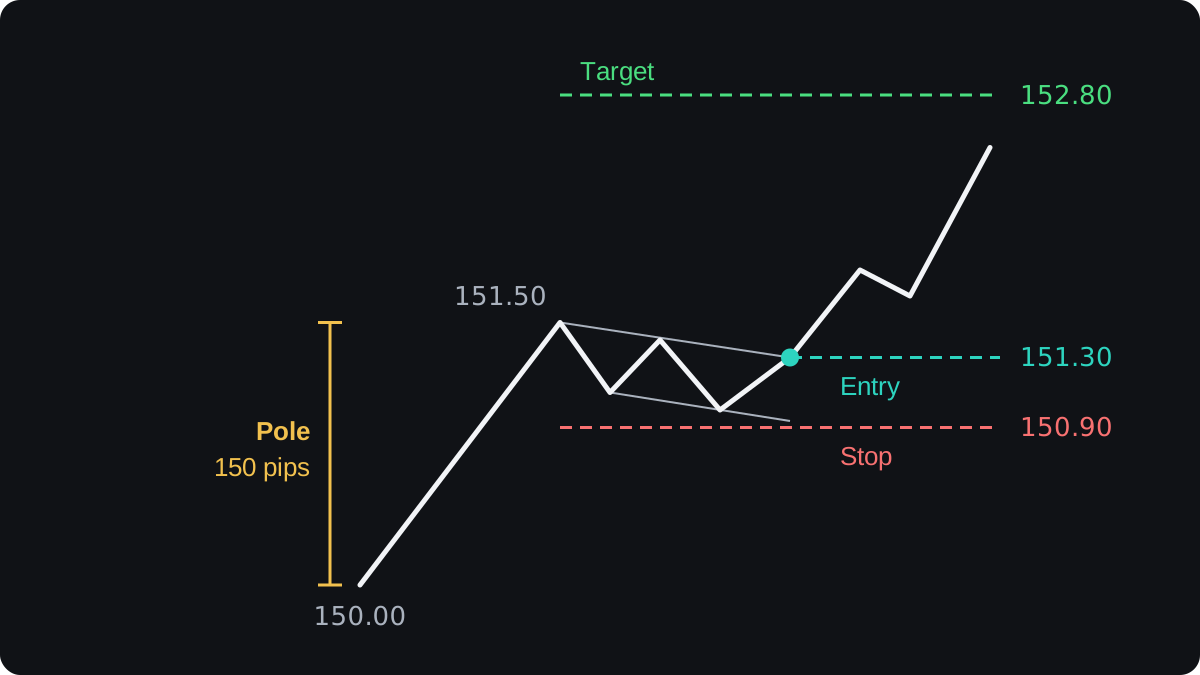
Treat that 150 pip target as a ceiling, since price often stalls short of it.
Worked example: a double top on EUR/USD
Prices are illustrative and ignore the spread. A pip on EUR/USD is 0.0001.
- Price peaks at 1.10500, falls to the 1.09900 neckline, rallies to 1.10480 and turns down.
- The height is 1.10500 minus 1.09900 = 0.00600, or 60 pips.
- A candle closes below the neckline at 1.09880, and you sell.
- The target is 1.09900 minus 0.00600 = 1.09300, 58 pips below the entry.
- The stop sits above the higher peak, at 1.10520: 64 pips of risk.
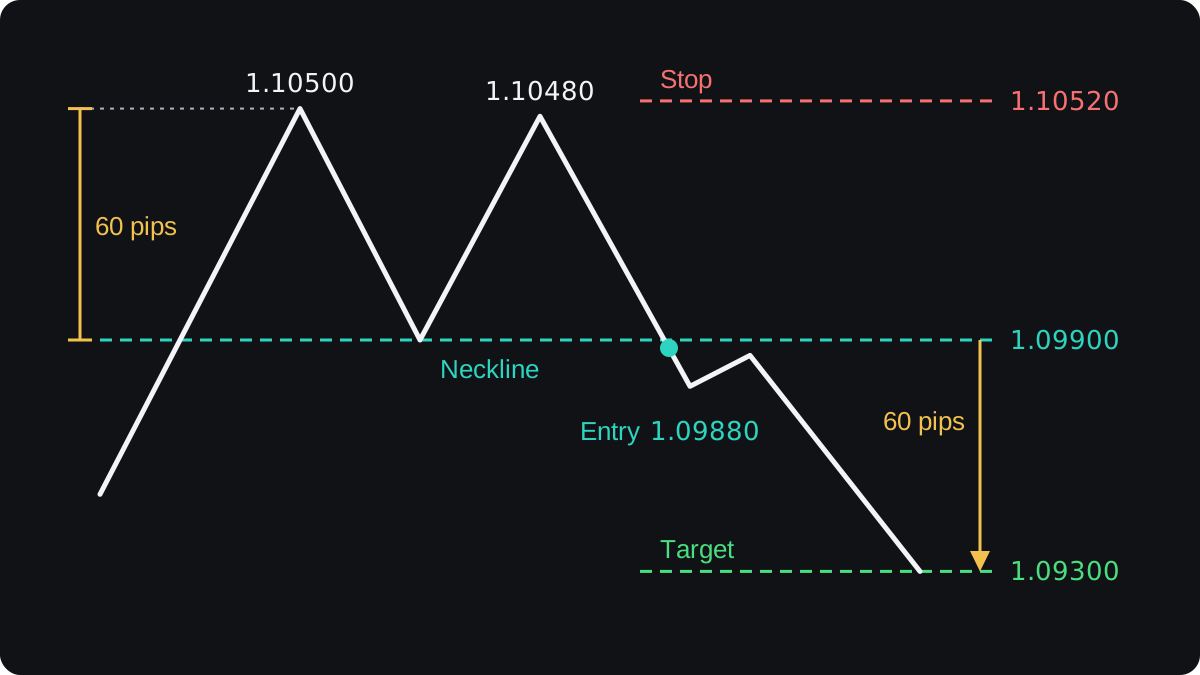
That pays about 0.9 for every 1 risked. A stop at 1.10020, just above the neckline, risks 14 pips for the same 58, about 4.1 to 1.
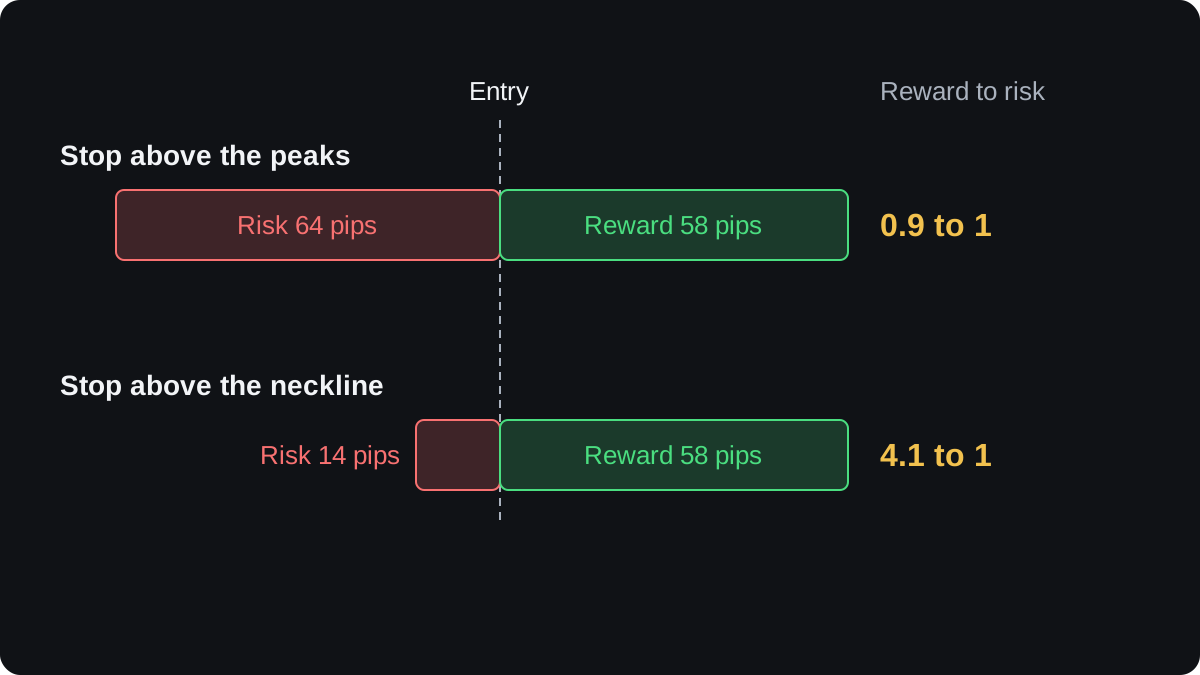
A retest of the neckline can hit that tight stop, while the wide stop is hit less often but pays less.
Size the position from the stop, as in the position size lesson. Risking $50 of a $5,000 account (an example, not a rule), with 0.01 lot of EUR/USD at $0.10 per pip in a US dollar account:
- 64 pip stop: $50 ÷ 64 = $0.78 per pip, rounded down to 0.07 lot. Risk 64 × $0.70 = $44.80; target $40.60.
- 14 pip stop: $50 ÷ 14 = $3.57 per pip, rounded down to 0.35 lot. Risk 14 × $3.50 = $49.00; target $203.00.
Where chart patterns let you down
Patterns are drawn by eye, so two traders can place the same neckline differently, and every number here moves with it.
A close beyond a boundary can reverse straight back inside, a false breakout, and the stop limits the damage.
The measured move is only a convention. Published tests of chart patterns give mixed results that depend on definitions, market, timeframe and costs.
أسئلة شائعة
Which chart pattern is the most reliable?
None is reliable on its own, and claimed success rates are hard to check. Test your own rules on a demo account first.
How do you calculate a chart pattern target?
Measure the pattern's height, or the pole for flags and pennants, and project it from the breakout price in the direction of the break.
Where do I put the stop loss on a chart pattern?
Beyond the point that would prove the pattern wrong. Then size the position so that distance risks only what you planned.
تابع التعلّم
 الفصل 2Head and shoulders.A head and shoulders is a chart pattern of three peaks, with the middle one highest, that can mark the end of an uptrend. The neckline joins the two lows between the peaks. Traders treat a close below it as the trigger and measure a target by projecting the head's height down from the break.
 الفصل 2Double tops and double bottoms.A double top is two peaks at about the same price with a dip between them; a double bottom is two lows with a bounce between. The low or high between them is the neckline. The pattern only counts once price closes beyond the neckline, and it can still fail after that.
 الفصل 2Ascending, descending and symmetrical triangles.A triangle is a pattern where price swings narrow between two converging trend lines. An ascending triangle has a flat top and rising lows, a descending triangle a flat bottom and falling highs, and a symmetrical triangle slopes on both sides. Each can break either way, so a common rule is to wait for a close outside the lines.
 الفصل 2Rising and falling wedges.A wedge is a chart pattern where price swings between two trend lines that slope the same way and move closer together. A rising wedge slopes up and is usually read as bearish. A falling wedge slopes down and is usually read as bullish. Neither is reliable on its own, so traders wait for a confirmed break.
 الفصل 2Flags and pennants.A flag is a short, narrow channel that slopes against a sharp price move, called the pole. A pennant is the same pause shaped like a small triangle. Traders read both as a rest before the move continues. A common plan trades the break in the pole's direction and projects the pole's length as a rough target.
 الفصل 2Rectangles.A rectangle is a sideways range where price bounces between two flat levels, resistance above and support below. It ends when price closes outside the box. Traders often sketch a target by adding the box's height to the broken level, but a rectangle can break either way and the break can fail.

