Rising and falling wedges.
A wedge is a chart pattern where price swings between two trend lines that slope the same way and move closer together. A rising wedge slopes up and is usually read as bearish. A falling wedge slopes down and is usually read as bullish. Neither is reliable on its own, so traders wait for a confirmed break.
هذا المحتوى متاح حاليًا باللغة الإنجليزية فقط.
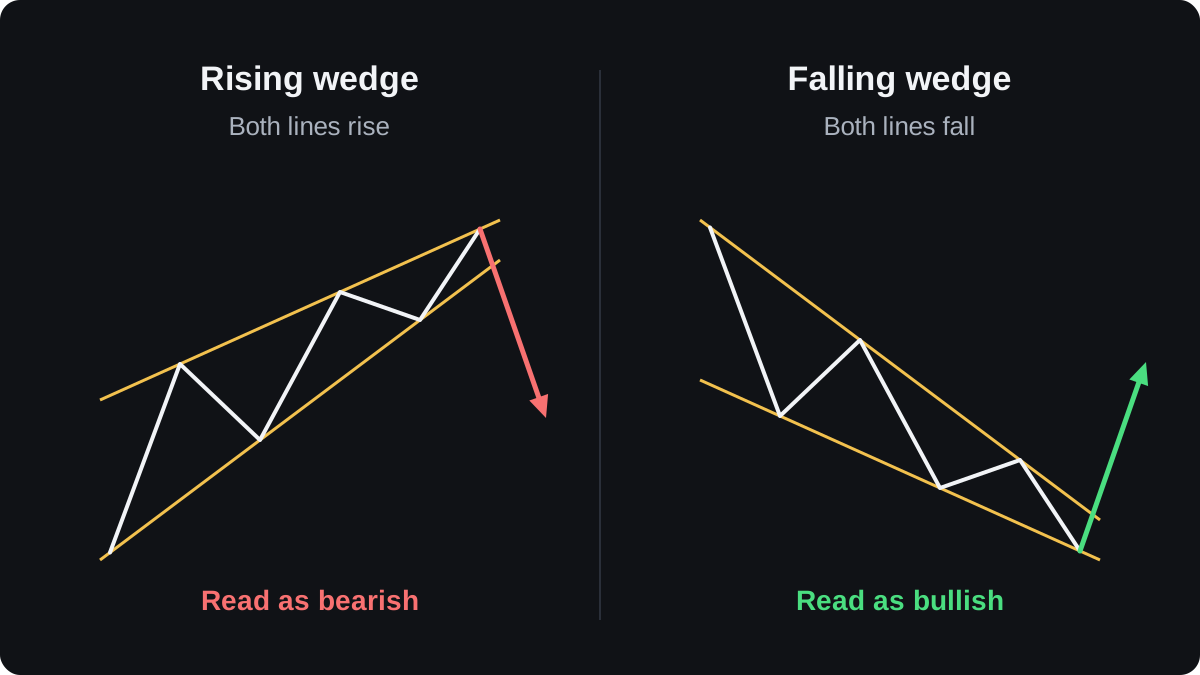
A wedge forms when price keeps making higher highs and higher lows, or lower highs and lower lows, yet each swing covers less ground than the one before.
Lines drawn along the highs and the lows slope the same way and close in on each other.
Traders read wedges against their slope. A wedge pointing up is taken as a sign that the rise is tiring, and a wedge pointing down as a sign that the fall is tiring.
That reading is a tendency, and a wedge can break either way, so any trade built on one needs a stop for the times the reading is wrong.
How do you spot a wedge on a chart?
Take an illustrative EUR/USD chart. Price makes swing lows at 1.0800, 1.0850 and 1.0900, so each low sits 50 pips above the last.
The swing highs come in at 1.0880, 1.0915 and 1.0950, only 35 pips apart. Both sets of points rise, but the lows rise faster.
Draw one trend line under the lows and one over the highs. The two lines slope upward and squeeze together, and that shape is a rising wedge.
Turn it upside down and you have a falling wedge: lower highs and lower lows, with the highs falling faster than the lows, so two downward lines converge.
A common rule of thumb is to want at least two touches on each line before calling it a wedge, and three make the lines easier to trust. Fewer touches leave too much room to draw the line you hoped to see.
Why is a rising wedge read as bearish?
In a rising wedge, buyers still push price to higher highs. Each push gains less than the one before, while dips get bought at ever higher prices. The range shrinks and the upward progress slows.
When price finally closes below the lower line, the steady buying that held up the lows has stopped. Traders who bought those dips may sell, and that selling is what a breakdown trader hopes to ride.
A rising wedge can form at the top of an uptrend, where it is read as a reversal.
It can also form as an upward drift inside a larger downtrend, where it is read as a pause before the fall resumes. Either way, the expected break is downward.
Why is a falling wedge read as bullish?
The falling wedge is the mirror image. Sellers push price to lower lows, but each new low is only slightly below the last, while the highs drop faster. Selling pressure is fading even though price is still going down.
A close above the upper line is the signal traders watch for. A falling wedge can end a downtrend or interrupt an uptrend, and in both cases the expected break is upward, though price can still break down through the lower line.
How is a wedge different from a triangle or a channel?
The slope of the two lines tells these shapes apart. In a wedge both lines slope the same way and converge. In a symmetrical triangle, covered in the triangles lesson, one line rises and the other falls.
In a price channel both lines slope the same way and stay parallel, so the range does not shrink. A rising channel describes a steady trend, while a rising wedge describes a trend whose swings are shrinking.
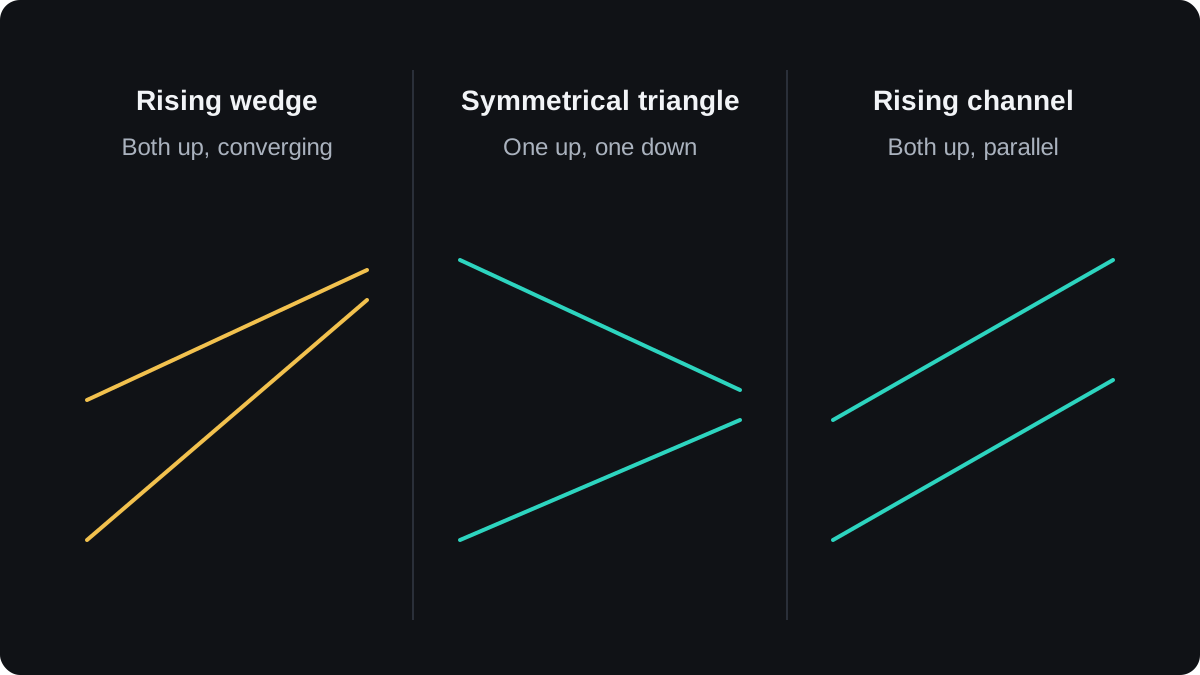
Ascending and descending triangles have one flat line. If neither line is flat and both point the same way, you are looking at a wedge.
A worked example: trading a rising wedge breakdown
This plan uses the EUR/USD wedge from the first section. The prices are illustrative, and the plan shows the arithmetic only. It is no recommendation to trade this pair or this pattern.
The account holds $5,000 and the trader risks 1% per trade, which is $50. On EUR/USD a pip is 0.0001, and one standard lot is worth $10 per pip.
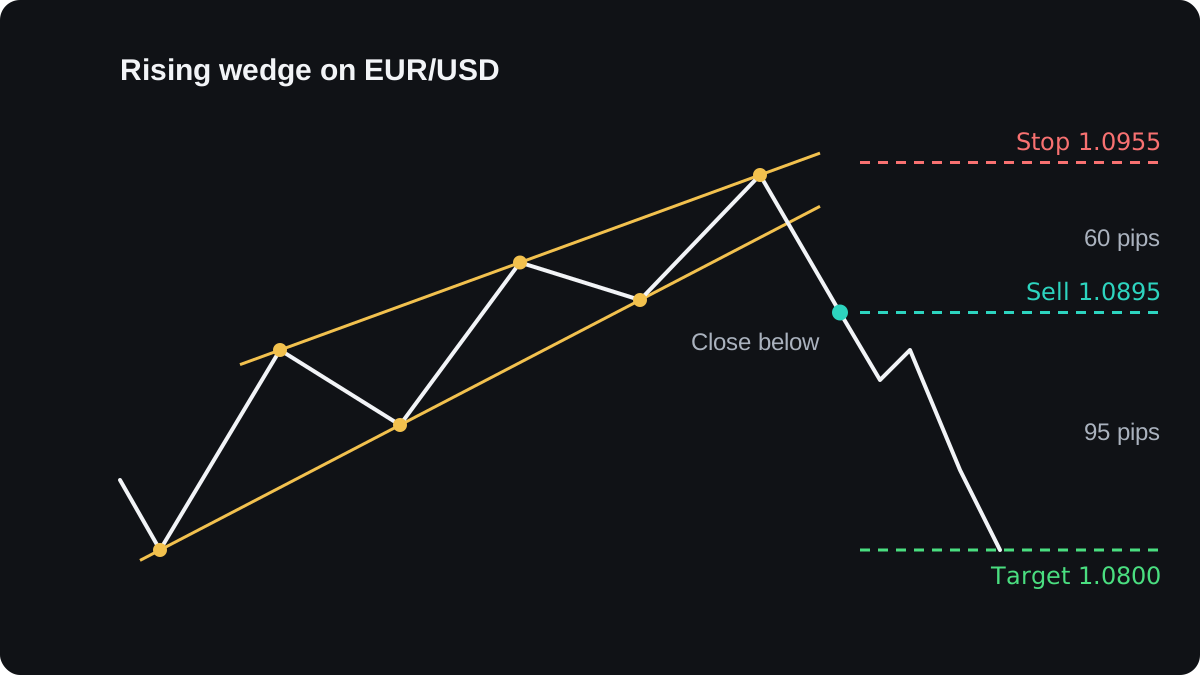
- Wait for a candle to close below the lower line. Here it closes at 1.0895, and the trader sells at that price.
- Place the stop above the last swing high of 1.0950, with a 5 pip buffer, at 1.0955. The distance is 1.0955 minus 1.0895 = 0.0060, which is 60 pips.
- Set the target at the start of the wedge, the first low at 1.0800. The distance is 1.0895 minus 1.0800 = 0.0095, which is 95 pips.
- Size the trade so the stop costs about $50: $50 ÷ (60 pips × $10) = 0.083 lot. Round down to 0.08 lot, where each pip is worth $0.80.
- If the stop is hit, the loss is 60 × $0.80 = $48. If the target is hit, the gain is 95 × $0.80 = $76.
The trade risks 60 pips to aim for 95, a reward to risk ratio of about 1.6 to 1. The position size lesson repeats the sizing step for other pairs.
These sums ignore the spread. A short trade closes with a buy at the ask, so on MetaTrader the stop and target trigger on the ask price, and a fast market can fill the stop beyond 1.0955.
Aiming for the start of the wedge is one convention. Other traders measure the widest part of the pattern or trail a stop instead, and there is no agreed best choice.
Where do wedges fail?
The drawing itself is the first weak point. Two traders can pick different swing points and so draw lines with different breakout levels. Decide your touch rules before you go looking for the pattern.
False breakouts happen in every narrowing pattern. Price closes below the lower line, triggers the sell, then climbs back inside the wedge and hits the stop. The false breakouts lesson covers how traders handle this.
Wedges also break the wrong way. A rising wedge can push through its upper line and keep climbing, which is one reason the stop sits just above the last high.
A big economic release can break a wedge in either direction within seconds, with no regard for where the lines were drawn.
Evidence for wedges is thin. Widely cited pattern statistics come mostly from stock charts, each with its own definitions, so there is no agreed success rate for wedges in forex. Patterns also look far clearer in hindsight than while they form.
If you want to use wedges, test your exact rules on past data first, as the backtesting lesson shows. The next lesson, on flags and pennants, covers short patterns that form after sharp moves.
أسئلة شائعة
Is a rising wedge bullish or bearish?
It is usually read as bearish, because the expected break is below the lower line. Price can still break upward, so traders wait for a close outside the pattern before acting.
What is the difference between a wedge and a triangle?
In a wedge both lines slope the same way and converge. In a symmetrical triangle the lines slope in opposite directions, and ascending and descending triangles have one flat line.
Is a falling wedge a reversal or continuation pattern?
It can be either. At the end of a downtrend it is read as a reversal, and as a pullback inside an uptrend it is read as a continuation, with an upward break expected in both cases.
Where do you put the stop loss on a wedge trade?
A common choice is just beyond the last swing point inside the wedge: above the last high for a rising wedge, below the last low for a falling wedge. In the example that meant a stop at 1.0955, 60 pips from the entry.
How reliable are wedge patterns?
There is no agreed, well-tested success rate for wedges in forex. Results depend on how you draw the lines and confirm the break, so test your own rules before risking money.
تابع التعلّم
 الفصل 2Head and shoulders.A head and shoulders is a chart pattern of three peaks, with the middle one highest, that can mark the end of an uptrend. The neckline joins the two lows between the peaks. Traders treat a close below it as the trigger and measure a target by projecting the head's height down from the break.
 الفصل 2Double tops and double bottoms.A double top is two peaks at about the same price with a dip between them; a double bottom is two lows with a bounce between. The low or high between them is the neckline. The pattern only counts once price closes beyond the neckline, and it can still fail after that.
 الفصل 2Ascending, descending and symmetrical triangles.A triangle is a pattern where price swings narrow between two converging trend lines. An ascending triangle has a flat top and rising lows, a descending triangle a flat bottom and falling highs, and a symmetrical triangle slopes on both sides. Each can break either way, so a common rule is to wait for a close outside the lines.
 الفصل 2Flags and pennants.A flag is a short, narrow channel that slopes against a sharp price move, called the pole. A pennant is the same pause shaped like a small triangle. Traders read both as a rest before the move continues. A common plan trades the break in the pole's direction and projects the pole's length as a rough target.
 الفصل 2Rectangles.A rectangle is a sideways range where price bounces between two flat levels, resistance above and support below. It ends when price closes outside the box. Traders often sketch a target by adding the box's height to the broken level, but a rectangle can break either way and the break can fail.
 الفصل 2Chart patterns cheat sheet.Most chart patterns share one set of rules. Enter when a candle closes beyond the pattern's boundary, put the stop beyond the opposite side or the last swing, and aim for the pattern's height projected from the breakout, or the pole's length for flags and pennants. This sheet gives each pattern's entry, stop and target.

