Fibonacci extensions for profit targets.
A Fibonacci extension projects how far a trend might run after a pullback. You measure the first swing, multiply it by ratios such as 61.8%, 100% and 161.8%, and add each result to the low of the pullback. Traders use the levels as possible take-profit targets, with no guarantee that price reaches them.
هذا المحتوى متاح حاليًا باللغة الإنجليزية فقط.

A retracement suggests where a pullback might stop. An extension looks one step further: if the trend picks up again, how far could the new leg run?
Traders use the answer to choose a profit target before they enter, so the exit is planned while they can still think calmly.
What does a Fibonacci extension measure?
Take EUR/USD. It rises from 1.08000 to 1.09000, then pulls back to 1.08500. These prices are illustrative, and they are the three points the tool needs.
In an uptrend, A is the swing low where the move started, B is the swing high where it paused, and C is the low of the pullback that followed. Here the first leg, A to B, is 100 pips.
A 100% extension copies that leg and starts it from C. Adding 100 pips to 1.08500 gives 1.09500.
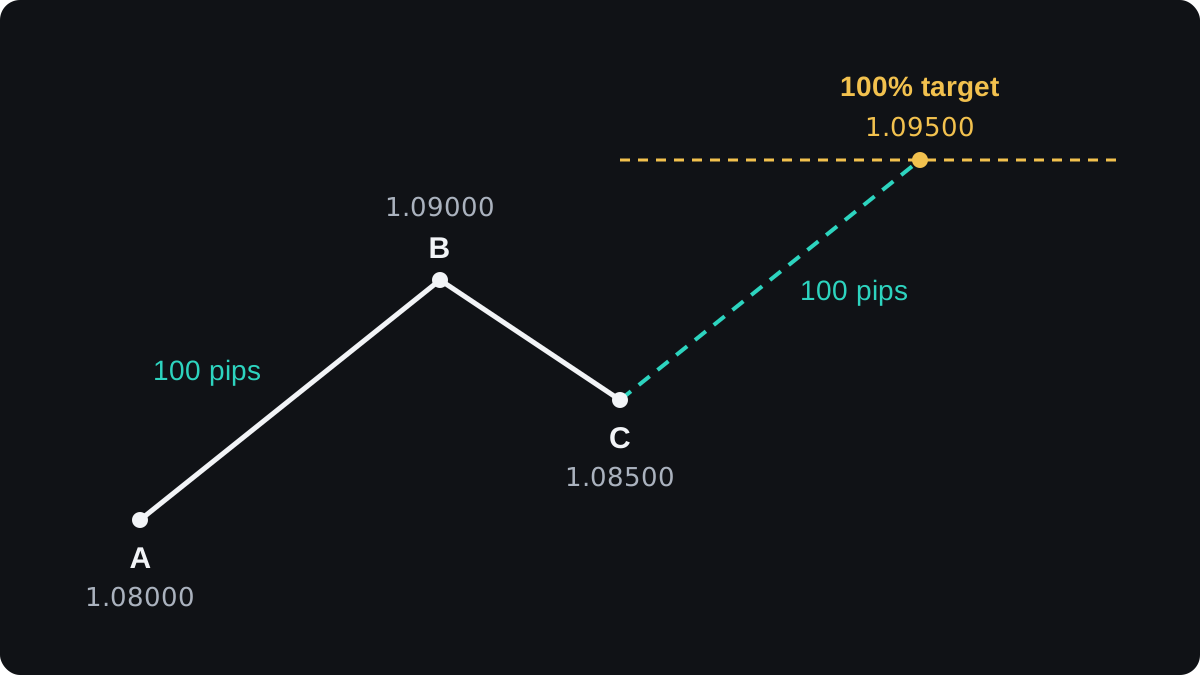
A Fibonacci extension is a level found this way, with the first leg multiplied by a ratio before it is added to C. Each level shows where price would be if the next leg were 61.8%, 100% or 161.8% of the first one.
For an uptrend the formula is: level = C + ratio × (B minus A). In a downtrend you subtract from C instead of adding.
How to draw Fibonacci retracements covers choosing A and B. In this example C sits exactly at the 50% retracement of the first leg, though a real pullback can stop anywhere.
Which extension levels do charting tools show?
Extension tools let you edit the list of ratios. The table shows the ones you are most likely to see, and they come from the same family as the retracement levels.
| Level | Where it comes from |
|---|---|
| 61.8% | 1 ÷ 1.618, the golden ratio turned over |
| 100% | Equal legs, often called a measured move |
| 127.2% | Roughly the square root of 1.618 |
| 161.8% | The golden ratio itself |
| 261.8% | 1.618 × 1.618 |
Strictly, 100% is not a Fibonacci ratio. It sits in the list because a second leg the same size as the first is a common reference point on charts.
Platforms name the three-point tool differently, for example Fibo Expansion in MetaTrader or Trend-Based Fib Extension in TradingView. Some traders instead stretch the retracement grid past 100%.
That grid uses only A and B and ignores C, so its levels land at different prices. Check which tool you are drawing before you trust a number.
Projecting targets on EUR/USD, step by step
Use the same illustrative prices: A = 1.08000, B = 1.09000 and C = 1.08500.
- Measure the first leg: 1.09000 minus 1.08000 = 0.01000, which is 100 pips.
- Multiply the leg by each ratio: 61.8 pips, 100 pips, 127.2 pips and 161.8 pips.
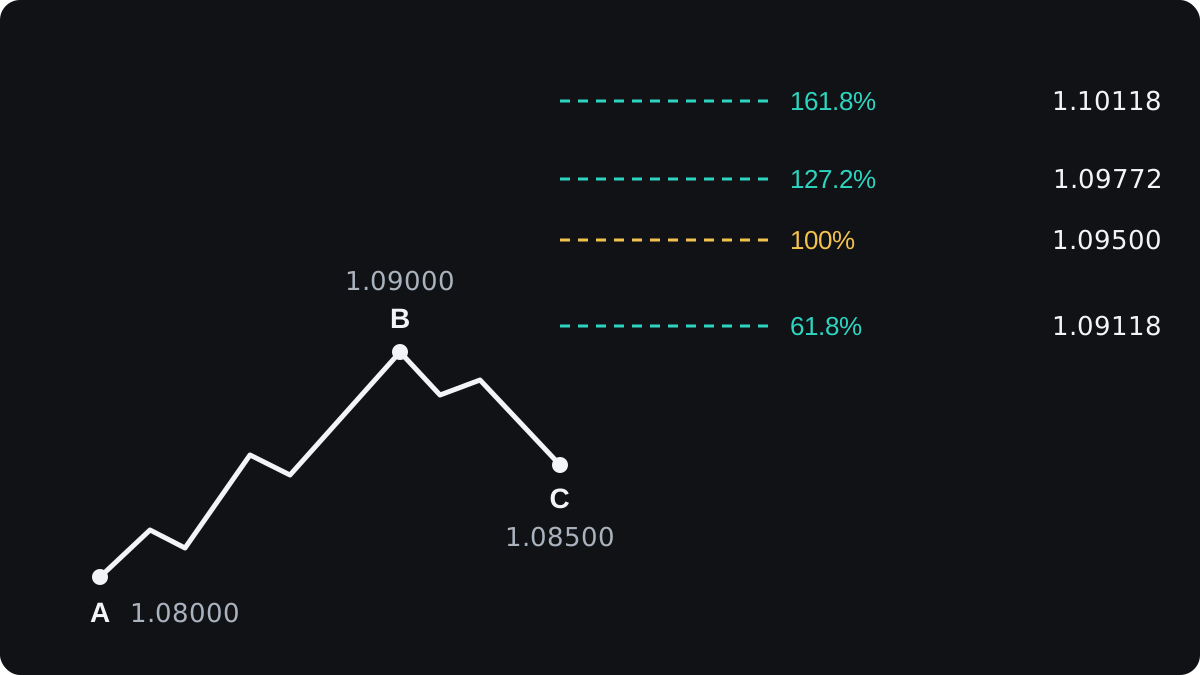
- Add each distance to C. For 61.8%, that is 1.08500 + 0.00618 = 1.09118.
- Repeat for the others: 1.08500 + 0.01000 = 1.09500, 1.08500 + 0.01272 = 1.09772, and 1.08500 + 0.01618 = 1.10118.
| Level | Distance from C | Price |
|---|---|---|
| 61.8% | 61.8 pips | 1.09118 |
| 100% | 100 pips | 1.09500 |
| 127.2% | 127.2 pips | 1.09772 |
| 161.8% | 161.8 pips | 1.10118 |
The 61.8% level, 1.09118, sits only 11.8 pips above B. Every level is measured from C, so a deeper pullback pulls all of them lower.
The Fibonacci calculator takes only a high and a low, so it cannot check these levels, which start from C.
Turning extension levels into a trade plan
An extension level is a candidate for a take-profit order. It only means something next to a stop loss, because the two together set your reward to risk.
Here is an illustrative plan. You buy 0.10 lot of EUR/USD at 1.08600 after price turns up from C. Your stop sits at 1.08300, 20 pips below the pullback low.
The distance from entry to stop is 1.08600 minus 1.08300 = 0.00300, or 30 pips. In a US dollar account a pip on 0.10 lot of EUR/USD is worth $1, so the trade risks $30.
| Target | Price | Reward | Reward to risk |
|---|---|---|---|
| 61.8% | 1.09118 | 51.8 pips, $51.80 | 1.73 to 1 |
| 100% | 1.09500 | 90 pips, $90.00 | 3.00 to 1 |
| 161.8% | 1.10118 | 151.8 pips, $151.80 | 5.06 to 1 |
Each reward is the target minus the entry, so 1.09500 minus 1.08600 = 90 pips, and 90 ÷ 30 = 3.00. These figures leave out spread and commission, which make every result slightly worse.
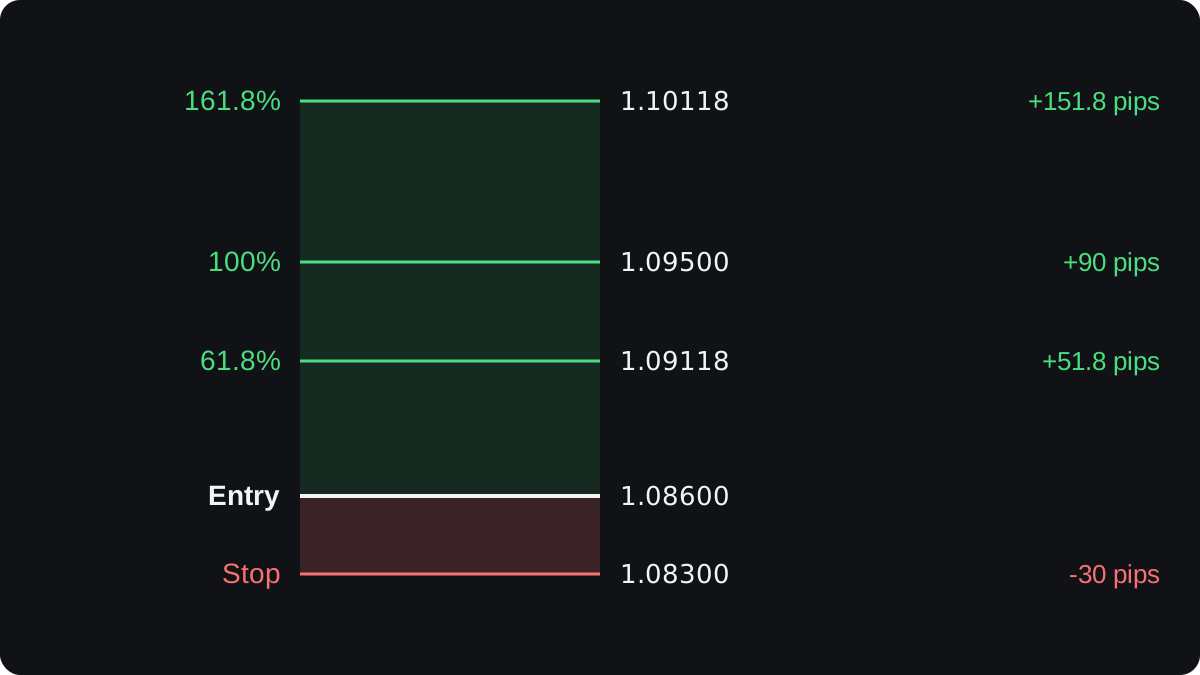
A further target pays more when price gets there. Price has to pass every nearer level on the way, so a further target is hit as often as a nearer one or less often.
The risk-reward lesson explains why a ratio means little without the win rate that goes with it.
Some traders split the position, closing half at a near level and leaving the rest for a further one. Taking partial profits shows how that changes the sums.
Some traders also give a level more weight when it lines up with older price history. If an earlier swing high sat at 1.10100, close to the 161.8% level at 1.10118, sellers appeared near that price before, as Fibonacci with support and resistance describes.
The stop is the other half of this plan, and placing stops with Fibonacci levels covers where it can go.
Projecting targets in a downtrend on USD/JPY
A falling market uses the same steps turned upside down. A is the swing high, B is the swing low, C is the bounce, and you subtract each distance from C.
Say USD/JPY falls from 152.00 (A) to 150.00 (B), then bounces to 151.00 (C). On a JPY pair a pip is 0.01, so the first leg of 2.00 is 200 pips.
- 61.8%: 2.00 × 0.618 = 1.236, and 151.00 minus 1.236 = 149.764, which is 123.6 pips below C.
- 100%: 151.00 minus 2.00 = 149.00, which is 200 pips below C.
- 161.8%: 2.00 × 1.618 = 3.236, and 151.00 minus 3.236 = 147.764, which is 323.6 pips below C.
USD/JPY is usually quoted to three decimals, so prices such as 149.764 appear on the platform exactly as written here.
Where Fibonacci extensions fail
An extension is a way to plan an exit, and nothing makes price reach any level. Some trends stall before the first level, and others run through 161.8% without a pause.
The evidence behind the ratios is weak. There is no solid research showing that prices react at Fibonacci levels more than at other levels, and part of any reaction may come from many people watching the same numbers.
With four or five levels on the screen, price will nearly always be near one of them. That makes the tool look better in hindsight than it was, so write your target down before you enter and judge it later.
The three points are also a choice. Two people picking different swings on the same chart get different targets, and moving C after the fact shifts every level at once.
Price can turn a few pips short of a level, so a take-profit placed exactly on it never fills. Around major news, price can jump past levels altogether, and a stop can then fill at a worse price than the one you set.
أسئلة شائعة
What is the difference between Fibonacci retracement and extension?
A retracement measures how far a pullback might go back into the previous move. An extension projects how far the next move might run, measured from the end of the pullback, point C.
Which Fibonacci extension level is best for take profit?
No level is reliably best. The 100% and 161.8% levels are common choices, and the decision usually depends on whether a level lines up with older support or resistance and on the reward to risk it gives.
How do you calculate a Fibonacci extension?
Subtract A from B to get the first leg, multiply it by the ratio, then add the result to C in an uptrend or subtract it in a downtrend.
With A at 1.08000, B at 1.09000 and C at 1.08500, the 161.8% level is 1.08500 + 0.01618 = 1.10118.
Do Fibonacci extensions work on every timeframe?
The arithmetic is the same on any chart, from five minutes to weekly. No good evidence shows the levels work better on one timeframe, and short charts offer more small swings, which makes choosing A, B and C harder.
تابع التعلّم
 الفصل 3What are Fibonacci retracement levels?Fibonacci retracement levels are lines drawn at fixed percentages of a price move to mark how deep a pullback has gone. The usual levels are 23.6%, 38.2%, 50%, 61.8% and 78.6%. The middle three get the most attention, but the evidence that price turns at them more than anywhere else is weak.
 الفصل 3How to draw Fibonacci retracements.In an uptrend, draw a Fibonacci retracement from the swing low to the swing high, so the levels sit below the high. In a downtrend, draw from the swing high to the swing low, so the levels sit above the low. Use the clear extremes of one completed move, wick to wick.
 الفصل 3Combining Fibonacci with support and resistance.Combining Fibonacci with support and resistance means checking whether a retracement level sits on a price the market has reacted to before, such as an old high. When the two line up within a few pips, traders call it a confluence zone and watch it more closely. Price can still break straight through a zone.
 الفصل 3Combining Fibonacci with trend lines.A Fibonacci retracement offers several levels where a pullback might stop. A trend line through earlier swing lows, or swing highs in a downtrend, narrows the choice: watch the level the line crosses around the time price returns to it. That meeting point is a zone of interest, and price can still break through it.
 الفصل 3Combining Fibonacci with candlestick patterns.Combining Fibonacci with candlesticks means waiting for a reversal candle, such as a hammer or an engulfing pattern, to close at a retracement level before you enter. The level shows where a pullback might stop, and the candle shows buyers or sellers stepping in. The cost is a later entry, and the signal still fails often.
 الفصل 3Placing stops with Fibonacci levels.A Fibonacci stop goes beyond the next retracement level past your entry, plus a small buffer for the spread and noise. Buy at 50% and the stop sits under 61.8%; sell at 50% and it sits above 61.8%. Then cut the lot size so the wider stop still risks only the money you planned.
 الفصل 3Fibonacci cheat sheet.Fibonacci retracement levels are 23.6%, 38.2%, 50%, 61.8% and 78.6% of the last swing, drawn from swing low to swing high in an uptrend. Extensions such as 127.2% and 161.8% project targets. A single level is weak evidence, so look for confluence, and stops usually sit beyond the level or the swing.

