Three inside up and three inside down.
Three inside up is a three-candle bullish reversal pattern: a long bearish candle, a small bullish candle whose body sits inside it, then a bullish candle that closes above the first candle's open. Three inside down is the mirror image after a rise. Both are a harami plus a confirming candle, and neither is a reliable signal on its own.
هذا المحتوى متاح حاليًا باللغة الإنجليزية فقط.

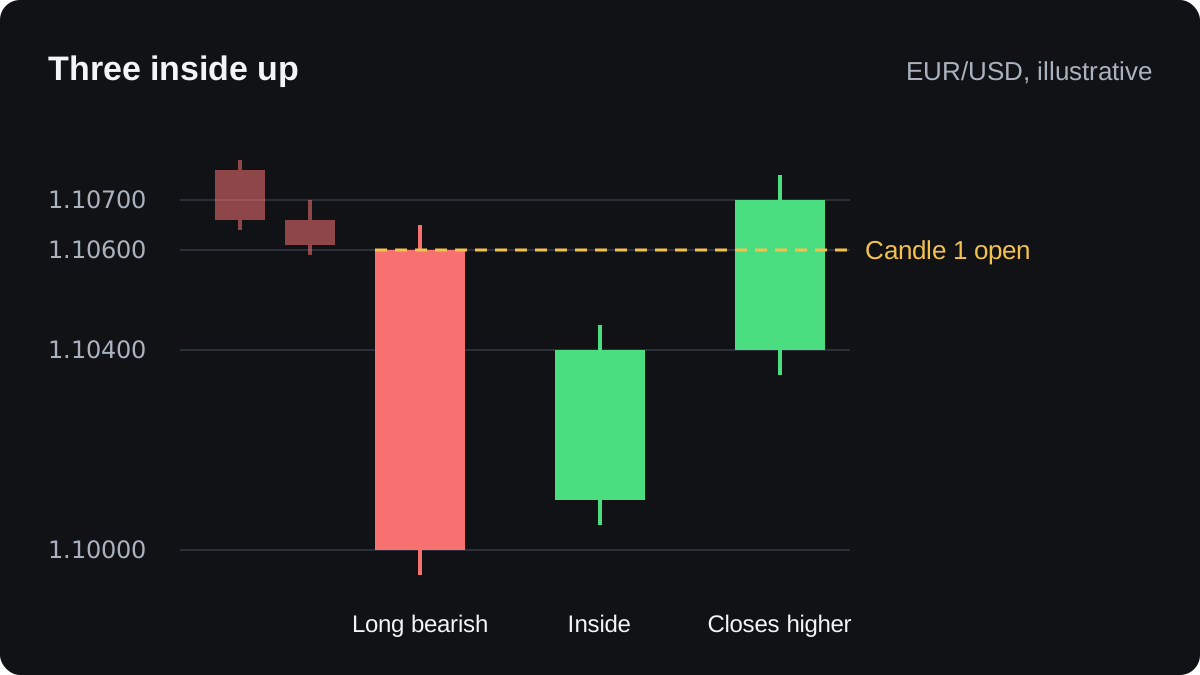
A long red candle closes near its low after several days of falling prices. The next candle is small and green, and its whole body fits inside the red one. A third candle then closes above the level where the red candle opened.
That sequence is called three inside up. Its mirror image at the end of a rise is three inside down.
Both start as a harami and add one candle to confirm it, so they flag a possible reversal later than the harami alone, with a little more evidence behind it.
What does a three inside up look like?
Take an illustrative daily chart of EUR/USD that has been falling. The prices below are round numbers chosen to show the shape.
- Candle 1 is a long bearish candle. It opens at 1.10600, dips to a low of 1.09950 and closes at 1.10000, a body of 60 pips.
- Candle 2 is a small bullish candle. It opens at 1.10100 and closes at 1.10400, so its body sits inside candle 1's body.
- Candle 3 is bullish. It opens at 1.10400 and closes at 1.10700, above candle 1's open of 1.10600.
The first two candles form a bullish harami: a small body contained within the body of the larger candle before it. The name is usually explained as the Japanese word for pregnant, after the shape.
Candle 3 is the confirmation. Sellers drove candle 1 and stalled in candle 2. In candle 3, buyers took price beyond the point where candle 1's selling began.
Definitions vary between books and charting software. Some only ask candle 3 to close above candle 2's close.
Others also want candle 2 to close at least halfway up candle 1's body. Here the halfway point is 1.10300, and candle 2's close of 1.10400 passes. A stricter definition gives fewer signals.
How is three inside down different?
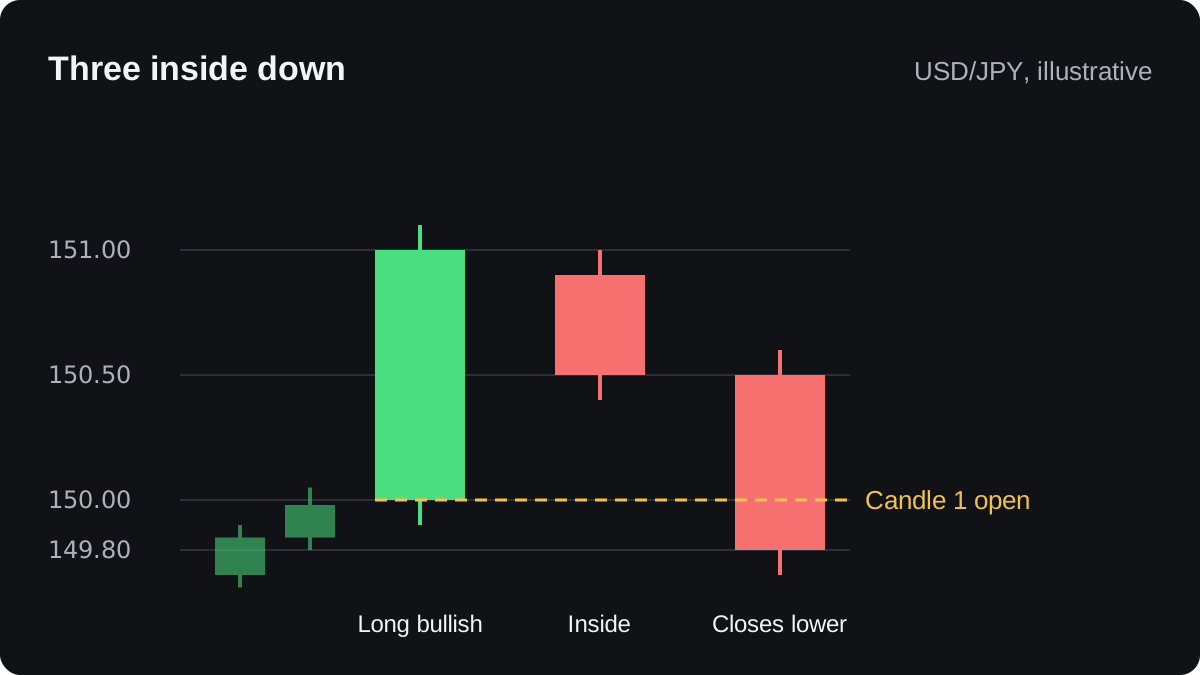
Three inside down is the same shape turned over, and it appears after a rise. Here is an illustrative USD/JPY example, where a pip is 0.01.
- Candle 1 is a long bullish candle from 150.00 to 151.00, a body of 100 pips, with a high of 151.10.
- Candle 2 is a small bearish candle from 150.90 to 150.50, inside candle 1's body.
- Candle 3 is bearish, from 150.50 to 149.80, closing below candle 1's open of 150.00.
The two versions follow the same rules in opposite directions:
| Feature | Three inside up | Three inside down |
|---|---|---|
| Comes after | A fall | A rise |
| Candle 1 | Long bearish | Long bullish |
| Candle 2 | Small bullish, body inside candle 1 | Small bearish, body inside candle 1 |
| Candle 3 | Bullish, closes above candle 1's open | Bearish, closes below candle 1's open |
| Suggests | Price may turn up | Price may turn down |
How does it compare with the harami on its own?
A harami alone says the trend has slowed. It does not show that the other side has taken over, and the old trend often carries on after one.
Waiting for candle 3 filters out some of those cases, and it costs you entry price. In the EUR/USD example, a trader acting on the harami could buy near candle 2's close at 1.10400. Waiting for confirmation moved the entry to 1.10700, 30 pips higher.
Replace the harami with an engulfing pattern, add the same confirming candle, and you get three outside up and three outside down.
The morning star and evening star are also three-candle reversals. Their small middle candle sits beyond candle 1's body instead of inside it.
When is the pattern worth noticing?
The shape matters less than where it appears. These checks remove many weak examples:
- There has to be a trend to reverse. Three inside up after a flat week tells you very little.
- A pattern at a support or resistance level that has turned price before has a reason behind it. One in the middle of a range usually means little.
- Candle 3 counts only once it has closed. Until then it can fall back below candle 1's open, and the pattern disappears.
- Short timeframes such as 5 minutes produce the shape constantly, and many of those examples are noise. Daily and 4-hour charts give fewer examples, each built from more trading.
Forex also has no single official daily close. Your broker's server time decides where each daily candle starts and ends, so one platform can show a three inside up in a week where another does not.
How could you plan a trade around it?
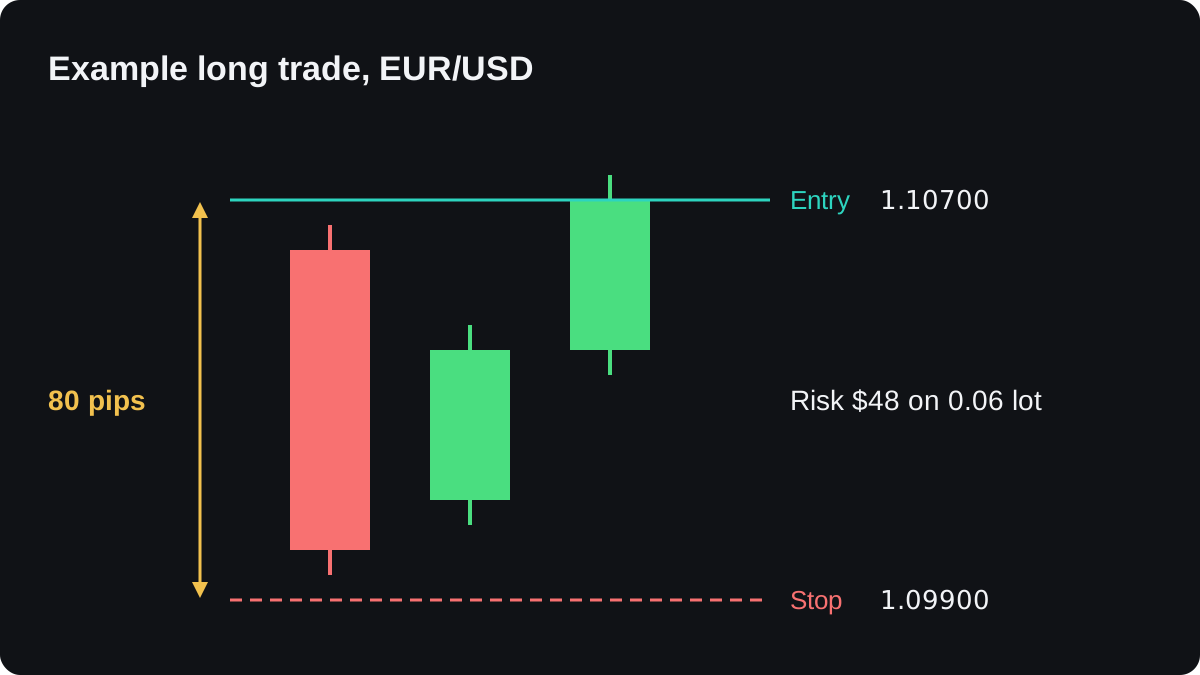
The pattern gives you a logical place for a stop: below the low that buyers defended. Here is the EUR/USD example as one illustrative plan in a USD account, ignoring the spread. It is an example, not a suggestion to trade.
- Buy at candle 3's close, 1.10700.
- Place the stop 5 pips below the pattern's low of 1.09950, at 1.09900.
- The stop distance is 1.10700 minus 1.09900 = 0.00800, which is 80 pips.
- With a $5,000 account and a 1% risk limit, the budget is $50.
- One standard lot of EUR/USD is worth $10 a pip, so 80 pips cost $800 per lot, and $50 ÷ $800 = 0.0625 lot.
- Round down to 0.06 lot. A pip is then worth $0.60, and 80 × $0.60 = $48 at risk.
Confirmation has a cost here too. Had the trader bought at candle 2's close of 1.10400, the same stop would be 50 pips away, and the $50 budget would allow 0.10 lot.
The USD/JPY version works the same way. A sell at 149.80 with a stop 5 pips above the pattern's high of 151.10, at 151.15, has a stop distance of 1.35, which is 135 pips.
On one lot a pip is 100,000 × 0.01 = ¥1,000, so 135 pips cost ¥135,000, about $893.15 at 151.15. The same $50 budget allows $50 ÷ $893.15 = 0.056 lot, rounded down to 0.05.
At 0.05 lot a pip is worth ¥50, so being stopped out loses 135 × ¥50 = ¥6,750, about $44.66 at 151.15.
The pattern says nothing about a profit target. The position size lesson covers the sizing method in full, and the lot size calculator does the sums for other pairs.
How reliable are three inside patterns?
No fixed success rate holds across markets and years. Published tests of candlestick patterns give mixed results, and those results change with the exact definition, the market and the period tested.
Treat the pattern as one piece of evidence. It shows that one side lost control for a few candles, and it cannot tell you whether the trend has ended.
The usual failure is a pause inside a strong trend. In a steep fall, a harami and one firm green candle can be a short bounce before sellers return and push price through the pattern's low.
Once price trades through that low, the reason for the trade has gone, which is why the stop sits there.
Before you rely on the pattern, test your exact definition on past charts. The backtesting lesson shows how, and the candlestick patterns cheat sheet puts this pattern next to the others in this module.
أسئلة شائعة
Is three inside up bullish or bearish?
It is bullish. It appears after a fall and suggests price may turn up, while three inside down is the bearish version after a rise.
What is the difference between a harami and three inside up?
A bullish harami is the first two candles. Three inside up adds a third bullish candle that closes above the first candle's open, which confirms the harami.
Does three inside up work in forex?
The shape appears on forex charts as on any other, but the evidence for its value is mixed and depends on how it is defined. Daily candles also depend on your broker's server time, so check the pattern on the chart you actually trade.
Do you need volume to confirm the pattern?
Spot forex has no central exchange, so there is no single volume figure. Trading platforms show tick volume, a count of price updates, which some traders use as a rough stand-in.
تابع التعلّم
 الفصل 2How to read a candlestick.A candlestick shows four prices for one trading period: the open, high, low and close. The thick body runs from open to close, and the thin wicks reach the high and the low. A candle that closed above its open is bullish, usually green, and one that closed below is bearish, usually red.
 الفصل 2What candle bodies and wicks tell you.A candle's body shows the move from open to close, and its wicks show prices reached but not kept. A long body means price moved far and held it; a short body means open and close ended near each other. A long lower wick shows a drop bought back, and a long upper wick a rise sold off.
 الفصل 2Spinning tops and marubozu candles.A spinning top is a candle with a small body and wicks on both sides longer than the body, showing that buyers and sellers ended the period roughly even. A marubozu is the opposite: a long body with little or no wick, showing one side controlled the period from open to close. Neither predicts the next move alone.
 الفصل 2Doji candles and what they signal.A doji is a candle that opens and closes at almost the same price, so its body is a thin line. It shows buyers and sellers ended the period even. The four common types are standard, long-legged, dragonfly and gravestone. A doji alone is a weak signal; context and the next candle matter.
 الفصل 2Hammer and hanging man patterns.A hammer and a hanging man are the same candle: a small body near the top and a lower wick at least twice as long. After a fall it is a hammer, a hint that selling may be fading. After a rise it is a hanging man, a warning that buying may be tiring. Each needs a confirming next candle.
 الفصل 2Inverted hammer and shooting star patterns.An inverted hammer and a shooting star are the same candle: a small body near the low and a long upper wick, usually at least twice the body. After a fall it is an inverted hammer, a possible turn up. After a rise it is a shooting star, a possible turn down. Both need a confirming close.
 الفصل 2Bullish and bearish engulfing patterns.An engulfing pattern is a two-candle reversal signal. A bullish engulfing forms after a decline, when a rising candle's body completely covers the previous falling candle's body. A bearish engulfing is the mirror image after a rise. It suggests control has switched sides, but it often fails in ranges and means more at a support or resistance level.
 الفصل 2Tweezer tops and bottoms.A tweezer top is two candles, usually side by side, that reach almost the same high after a rise. A tweezer bottom is two candles with almost the same low after a fall. Both show a price the market rejected twice. They mean most at a known level and are weak signals on their own.
 الفصل 2Morning star and evening star patterns.A morning star is a three-candle pattern at the end of a fall: a long bearish candle, a small-bodied star near the low, then a long bullish candle that closes above the first candle's midpoint. An evening star is the mirror image after a rise. Both suggest a possible reversal, and neither guarantees one.
 الفصل 2Three white soldiers and three black crows.Three white soldiers is three bullish candles in a row after a decline, each closing higher and near its high. Three black crows is the bearish mirror after a rise. Both suggest one side has taken control, but they often appear after a large move, can fail, and are best read with the trend and a planned stop.
 الفصل 2Candlestick patterns cheat sheet.A candlestick pattern is a shape made by one, two or three candles that hints at who controlled price. Single candles such as the doji, hammer and shooting star show rejection or indecision. Two- and three-candle patterns such as engulfing and morning star show a shift. None predicts price reliably on its own.

