Trending versus ranging markets.
A trending market makes a run of swings in one direction: higher highs and higher lows in an uptrend, lower highs and lower lows in a downtrend. A ranging market turns back and forth between a ceiling and a floor. Swing points, a moving average's slope and ADX help you tell them apart.
هذا المحتوى متاح حاليًا باللغة الإنجليزية فقط.

Before you choose a strategy, it helps to know whether price is going somewhere or swinging back and forth. A method built for one of those conditions often struggles in the other.
Neither condition announces itself. You read it from recent price, and you revise the label as new candles arrive.
What does a trending market look like?
Picture EUR/USD on a 4-hour chart. It climbs from 1.08000 to 1.08600, dips to 1.08300, climbs to 1.08900, dips to 1.08550 and then reaches 1.09200. These prices are illustrative.
Each peak is above the one before it, and each dip stops above the previous dip. That pattern of higher highs and higher lows is an uptrend.
A trend is a run of price swings that keeps stepping in one direction. A downtrend is the mirror image, with lower highs and lower lows.
Count the swings in pips. The legs up were 60, 60 and 65 pips, and the pullbacks against the trend were 30 and 35 pips. The net move from 1.08000 to 1.09200 was 120 pips.
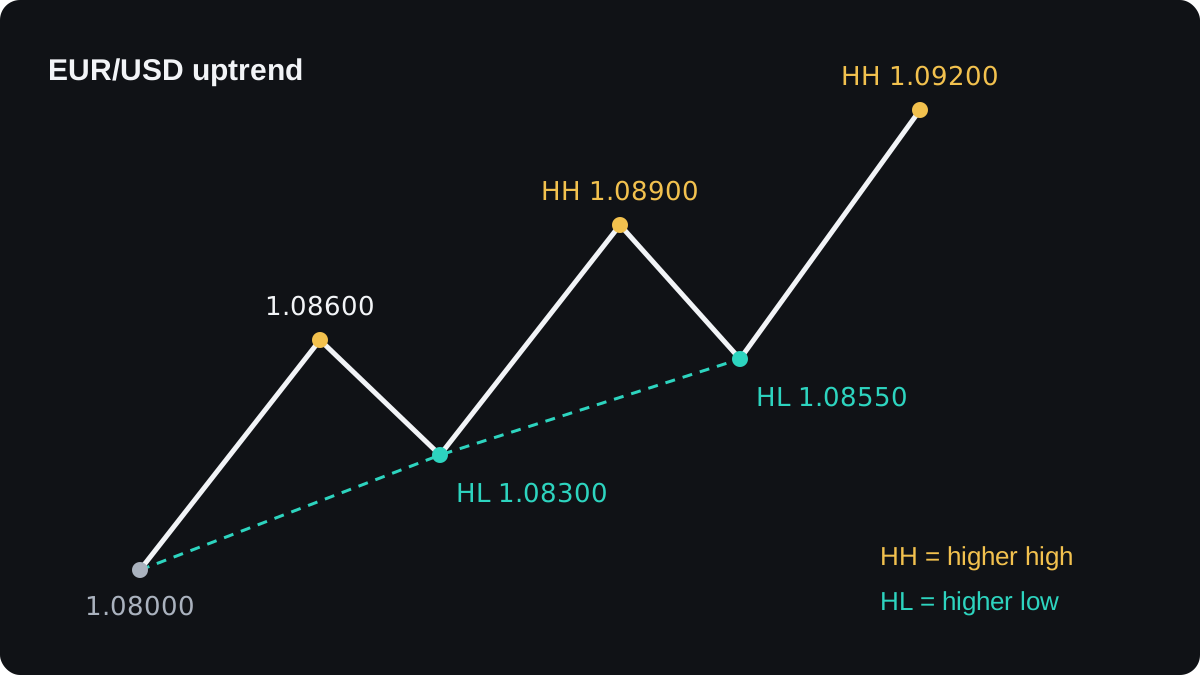
The turning points of each leg are swing highs and swing lows. The market structure lesson shows how to pick them out the same way every time.
In this uptrend, the first warning would be a dip below the last higher low at 1.08550. A break there would not prove the trend is over. It would mean the higher-low pattern has failed, so the label needs a fresh check.
What does a ranging market look like?
Now take USD/JPY over several days. It rises to 150.15, falls to 149.05, rises to 150.20, falls to 149.00, rises to 150.10 and falls to 149.10. Again, the prices are illustrative.
The highs do not keep rising and the lows do not keep falling. Price turns near the same two levels each time.
That is a range, also called a sideways market: price moving between a ceiling and a floor without lasting progress in either direction.
The ceiling is about 150.20 and the floor about 149.00. On a yen pair a pip is 0.01, so the width is 150.20 minus 149.00 = 1.20, which is 120 pips.
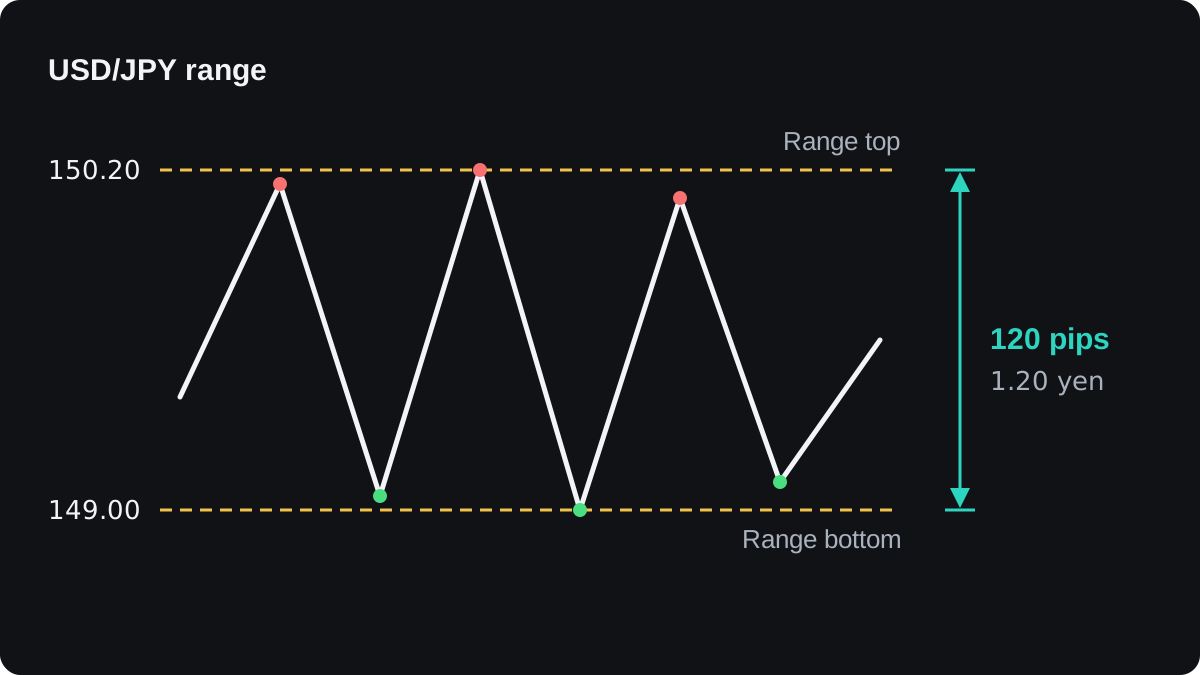
The three highs sit within 10 pips of each other, from 150.10 to 150.20, and so do the three lows. Range edges are zones a few pips wide, like any support and resistance level.
A range ends when price leaves it and stays out. A push through an edge that quickly returns inside is a false breakout, the subject of the previous lesson.
How can you tell which one you are in?
No single check gives a certain answer. Using two or three together gives you a working label you can plan around.
Read the swings
Mark the last three or four swing highs and swing lows. If both step the same way, call it a trend. If they overlap and keep turning near the same levels, call it a range.
Sometimes the highs fall while the lows rise, so price is squeezing into a narrower space. Neither label fits well until price leaves the squeeze.
Check the slope of a moving average
A moving average smooths price into one line. In a trend it slopes clearly, and price spends most of its time on one side of it.
In a range the average runs nearly flat, and price crosses it again and again. How flat counts as flat depends on the pair and the timeframe, so compare against the same chart over time.
Use a trend strength reading
The ADX indicator measures how strong a trend is without saying which way it runs. A common rule of thumb reads ADX above 25 as trending and below 20 as weak or no trend.
Those levels are conventions. ADX is built from smoothed averages, so it rises after a trend is under way and can stay high for a while after the trend fades.
How do you put a number on it?
One simple measure compares two distances over the same candles. The net move is how far price ended from where it started. The path is the total distance travelled, adding every candle-to-candle change as a positive number.
Divide the net move by the path. A result near 1 means price went almost straight; a result near 0 means it wandered and ended close to its start. This is sometimes called an efficiency ratio.
Here are two samples of six 4-hour closes on EUR/USD, with illustrative prices. The first sample closes at 1.08000, 1.08200, 1.08150, 1.08400, 1.08350 and 1.08600.
- The five changes are +20, −5, +25, −5 and +25 pips.
- The path is 20 + 5 + 25 + 5 + 25 = 80 pips.
- The net move is 1.08600 − 1.08000 = 0.00600, which is 60 pips.
- The ratio is 60 ÷ 80 = 0.75.
The second sample closes at 1.08000, 1.08250, 1.08050, 1.08300, 1.08100 and 1.08200.
- The five changes are +25, −20, +25, −20 and +10 pips.
- The path is 25 + 20 + 25 + 20 + 10 = 100 pips.
- The net move is 1.08200 − 1.08000 = 0.00200, which is 20 pips.
- The ratio is 20 ÷ 100 = 0.20.
| Sample | Net move | Path travelled | Ratio |
|---|---|---|---|
| Trending | 60 pips | 80 pips | 0.75 |
| Ranging | 20 pips | 100 pips | 0.20 |
The ranging sample travelled further, 100 pips against 80, yet finished only 20 pips from where it began.
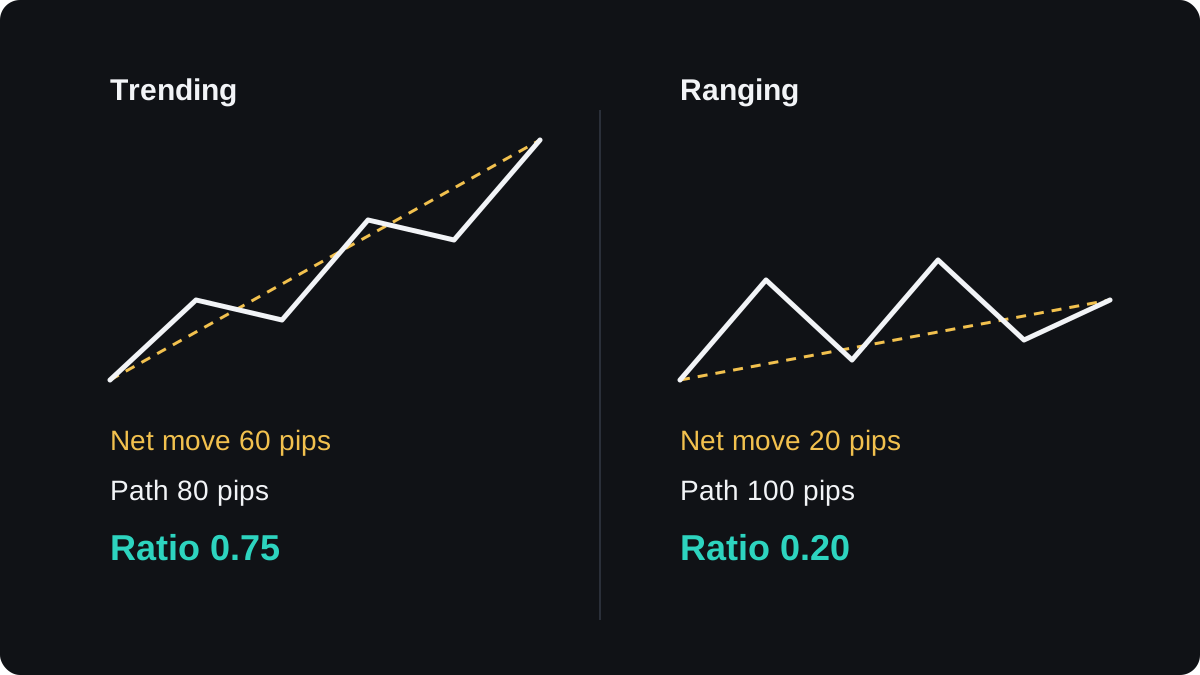
Use the size of the net move and ignore its sign, so a downtrend scores the same way as an uptrend. The reading also changes with the number of candles, so keep one setting and compare like with like.
No official level separates a trend from a range on this scale. The ratio tells you how direct the recent move was, and you still decide where to draw the line.
Why does the answer depend on the timeframe?
A daily chart can show a clean uptrend while a 15-minute chart inside one of those days is stuck in a range. Both readings are correct for their own timeframe.
In the first EUR/USD example, the 30 pip pullback from 1.08600 to 1.08300 could look like a full downtrend on a 5-minute chart.
So label the market on the timeframe your trades actually use. A higher timeframe adds context, as the multiple timeframes lesson explains.
The two states also take turns. A long range can end in a breakout that starts a trend, and a trend often pauses in a range before it continues or reverses, so every label is provisional.
Why does the label matter before you choose a strategy?
Trend-following methods, such as a breakout entry or a moving average crossover, buy strength and sell weakness. In a range they tend to enter near an edge just as price turns back, which can bring a string of small losses.
Range methods do the reverse. They sell near the ceiling and buy near the floor, expecting price to return to the middle. In a strong trend, that means selling into a rise or buying into a fall again and again.
You only know for certain which state the market was in once it is over. Swings, slopes and ADX all describe the recent past, which gives you a reasonable guess about the present and no forecast of the next move.
How far price swings each day is a separate question from whether it trends. The next lesson, measuring volatility, covers that, and matching your strategy to the market brings both together.
أسئلة شائعة
How do you know if the market is trending or ranging?
Compare the last few swing highs and lows. Highs and lows that step the same way mean a trend, while overlapping swings that turn near the same levels mean a range. A sloping moving average or an ADX reading can back that up.
Is the market trending or ranging most of the time?
There is no reliable single figure, because it varies by pair, timeframe and period. Treat any fixed percentage quoted without a source with caution, and check the pair and timeframe you trade.
Which is easier to trade, a trend or a range?
Neither is easier in general. Trends can give larger moves but pull back sharply, and ranges have clear edges that eventually break. The bigger risk is using a method built for the other state.
What ADX value means a trending market?
By common convention, ADX above 25 suggests a trend and below 20 suggests a weak or absent one. These are rules of thumb, and ADX reacts late because it is built from averages.
Can a market be trending and ranging at the same time?
Yes, on different timeframes. A daily uptrend can contain a range on a 15-minute chart, so always say which timeframe your label refers to.
تابع التعلّم
 الفصل 3Measuring volatility.Volatility is how far price tends to move in a given period. The most common measure is average true range (ATR), the average of recent true ranges, where true range includes any gap from the previous close. ATR shows how far a pair usually moves, but it gives no direction and only describes the past.
 الفصل 3Matching your strategy to the market.Match the setup to the market's behaviour. In a trend, setups that buy pullbacks or breakouts and trail the stop suit the move. In a range, buying near support and selling near resistance with a fixed target suits it. When signals conflict, news is due or costs are large next to the target, standing aside or cutting size is the safer choice.

