Measuring volatility.
Volatility is how far price tends to move in a given period. The most common measure is average true range (ATR), the average of recent true ranges, where true range includes any gap from the previous close. ATR shows how far a pair usually moves, but it gives no direction and only describes the past.
هذا المحتوى متاح حاليًا باللغة الإنجليزية فقط.

Some days EUR/USD covers 40 pips from its low to its high. Other days it covers 120. Volatility is the size of those swings. Measuring it tells you how much room a trade needs and how much a bad day can cost.
Volatility says nothing about direction. A pair can be very volatile while going nowhere, swinging up and down inside the same band.
How far does a pair usually move?
The simplest measure is the distance from a candle's high to its low, counted in pips. If a daily EUR/USD candle has a high of 1.1010 and a low of 1.0910, the day's range is 100 pips.
A single day tells you little. An average of the last 10 or 20 days gives a usual daily range, which you can compare with how far price has already moved today.
This is a different question from the one in trending versus ranging markets. Trend describes the shape of price movement and volatility describes its size, so a quiet trend and a wild range are both possible.
What is true range, and why does it count gaps?
Forex trades around the clock from Monday to Friday, so a daily candle usually opens where the last one closed. Gaps appear mostly after a weekend, when news can move the first price of the week.
Say Friday closes at 1.0960 and Monday opens at 1.0995, with a low of 1.0990. Monday's high minus low starts at 1.0990, so it leaves out the 30 pips between Friday's close and Monday's low.
True range adds the gap back. It is the largest of three distances:
- Today's high minus today's low.
- Today's high minus the previous close, ignoring the sign.
- Today's low minus the previous close, ignoring the sign.
Here are five illustrative daily candles on EUR/USD, each with the close of the day before. Day 3 is the Monday.
| Day | High | Low | Previous close | High minus low | True range |
|---|---|---|---|---|---|
| 2 | 1.0975 | 1.0905 | 1.0920 | 70 pips | 70 pips |
| 3 | 1.1040 | 1.0990 | 1.0960 | 50 pips | 80 pips |
| 4 | 1.1055 | 1.0985 | 1.1030 | 70 pips | 70 pips |
| 5 | 1.1010 | 1.0910 | 1.1000 | 100 pips | 100 pips |
| 6 | 1.0950 | 1.0890 | 1.0925 | 60 pips | 60 pips |
On day 3 the candle spans 50 pips. The distance from the previous close at 1.0960 up to the high at 1.1040 is 80 pips, so the true range is 80.
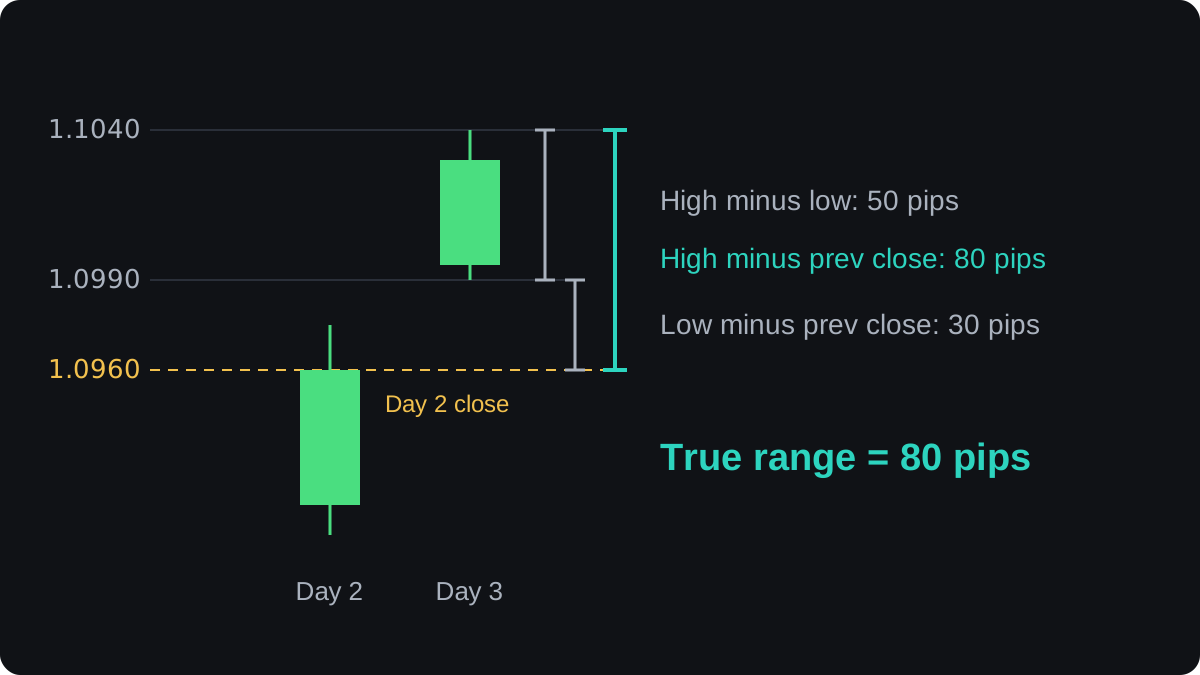
On the other four days there was no gap. The previous close sat inside the candle, so high minus low was already the largest of the three distances.
How is average true range calculated?
Average true range (ATR) is the average of recent true ranges. J. Welles Wilder introduced it in 1978, and the usual setting is 14 periods.
With a 5-day setting, the table gives 70 + 80 + 70 + 100 + 60 = 380 pips, and 380 ÷ 5 = 76 pips. Over these days EUR/USD moved about 76 pips a day, gaps included.
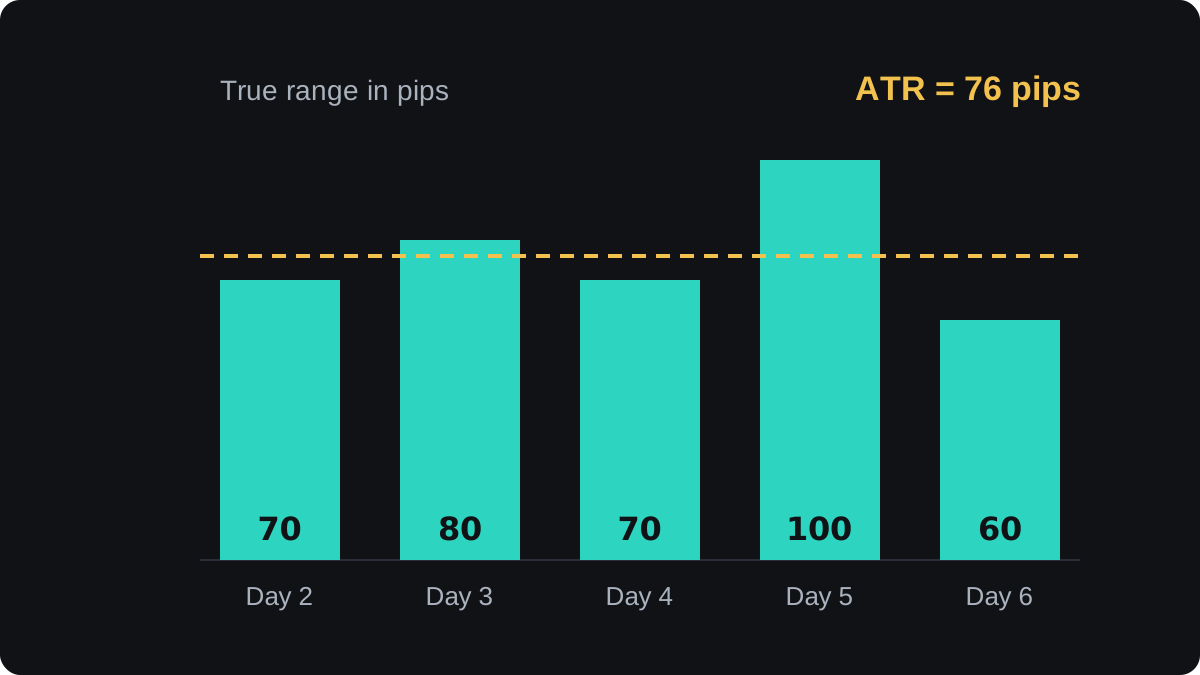
Wilder's own version smooths the average. On a 14-period setting, each new value is (previous ATR × 13 + today's true range) ÷ 14.
Say yesterday's 14-day ATR was 76 pips and today's true range is 90 pips. Then (76 × 13 + 90) ÷ 14 = 1,078 ÷ 14 = 77 pips. One wide day moves the reading only a little.
Platforms differ in which average they use, so two charts can show slightly different ATR values. Most show ATR in price units: 0.0076 on EUR/USD is 76 pips, and 0.76 on USD/JPY is also 76 pips.
ATR works on any timeframe. On an hourly chart it measures the usual hourly move.
How can ATR set your stop and trade size?
One common use is placing a stop loss at a multiple of ATR, so the stop sits outside the pair's normal noise. The multiple of 1.5 below is an example only; no single multiple has been shown to be best.
Say your account holds $5,000 and you plan to risk 1% on a trade, which is $50. On EUR/USD in a US dollar account, one pip on 0.01 lot is worth $0.10.
- ATR is 76 pips, so the stop is 1.5 × 76 = 114 pips away.
- Risk per 0.01 lot is 114 × $0.10 = $11.40.
- $50 ÷ $11.40 = 4.39, so you round down to 4 × 0.01 = 0.04 lot.
- If the stop is hit, the loss is 114 × $0.40 = $45.60.
In a quieter month the ATR might be 40 pips. The stop becomes 1.5 × 40 = 60 pips, and risk per 0.01 lot is 60 × $0.10 = $6.00.
Then $50 ÷ $6.00 = 8.33, so the size is 0.08 lot. A full loss is 60 × $0.80 = $48.00.
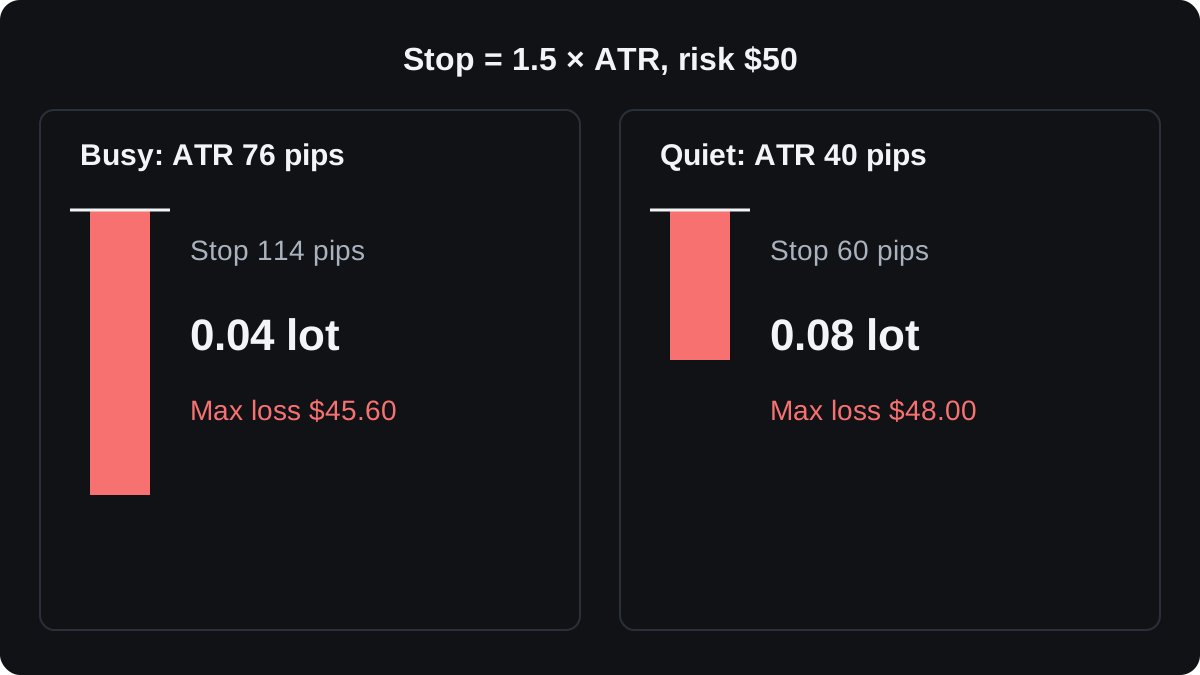
The money at risk stays close to $50 in both cases. Wider swings mean a wider stop and a smaller position, and the position size lesson gives the general formula.
Other ways to judge volatility
Standard deviation measures how widely closing prices spread around their average. Bollinger Bands are usually drawn two standard deviations either side of a moving average, so the bands widen when volatility rises and narrow when it falls.
Implied volatility comes from option prices and shows how much option traders expect a pair to move, quoted as a yearly percentage. Dividing it by 16 gives a rough size for one day's move.
For example, 8% a year ÷ 16 = 0.5% a day, which is about 55 pips on EUR/USD at 1.1000. The 16 is close to the square root of the number of trading days in a year.
Time of day matters as well. Pairs tend to move more while the major trading sessions are open, especially when London and New York overlap, and less in the hours between them.
Scheduled news often brings the biggest short-term moves. An economic calendar shows when rate decisions and major data are due, and the move around a release can be several times a normal hourly ATR.
Where volatility measures fall short
Every measure here looks backwards. ATR tells you how far price moved over the last 14 periods and nothing certain about the next one.
Volatility tends to cluster, with busy periods following busy ones and quiet following quiet. That makes recent ATR a fair guide much of the time, and a poor one when a surprise ends a calm stretch.
After a sudden jump, ATR catches up slowly. With 14-period smoothing, one huge day adds only a fraction of its size, so the reading understates the new conditions for a while.
A rising ATR can come from a strong trend or from a choppy market swinging both ways. The reading alone cannot tell you which.
Pips mislead when you compare pairs. A GBP/JPY ATR of 150 pips at 190.00 is 1.50 yen, or 0.79% of price.
A EUR/USD ATR of 76 pips at 1.0940 is 0.69% of price. In pips one pair looks twice as volatile as the other, while in percent the gap is much smaller.
A stop placed by ATR can still be jumped. A weekend gap or a news spike can fill a stop order well beyond its level.
The next lesson, matching your strategy to the market, puts volatility and trend together to judge which approach fits current conditions.
أسئلة شائعة
What is a good ATR value?
There is no good or bad value. ATR describes how much a pair has been moving, and it only means something next to that pair's own history and your stop distance.
What does ATR 14 mean?
It is average true range over the last 14 periods, the default on most charting platforms. On a daily chart that is 14 days, and on an hourly chart it is 14 hours.
Does a high ATR mean price will go up?
No. ATR measures the size of moves in both directions and says nothing about which way price will go next.
Why does my platform show ATR as 0.0076 instead of 76?
Most platforms show ATR in price units. On EUR/USD 0.0076 is 76 pips, and on a yen pair 0.76 is 76 pips because the pip there is 0.01.
Which timeframe should I use for ATR?
The usual approach is the timeframe you trade on, so the reading matches the moves your stop must survive. A daily ATR is far wider than the noise on a trade held for an hour.
تابع التعلّم
 الفصل 3Trending versus ranging markets.A trending market makes a run of swings in one direction: higher highs and higher lows in an uptrend, lower highs and lower lows in a downtrend. A ranging market turns back and forth between a ceiling and a floor. Swing points, a moving average's slope and ADX help you tell them apart.
 الفصل 3Matching your strategy to the market.Match the setup to the market's behaviour. In a trend, setups that buy pullbacks or breakouts and trail the stop suit the move. In a range, buying near support and selling near resistance with a fixed target suits it. When signals conflict, news is due or costs are large next to the target, standing aside or cutting size is the safer choice.

