Average Directional Index (ADX).
The Average Directional Index (ADX) measures how strong a trend is on a scale of 0 to 100, without saying which way it points. Readings above about 25 are commonly read as a trending market and below about 20 as a weak or ranging one. Two companion lines, +DI and −DI, show direction.

The RSI tells you whether recent closes lean up or down. The Average Directional Index answers a separate question: is price moving in a sustained way, or is it chopping sideways?
It gives one number from 0 to 100. A high number says a trend is strong, whichever way it points, and a low number says there is little trend to speak of.
What does the ADX tell you?
Picture EUR/USD climbing in steady steps for three weeks on a daily chart. While it climbs, the ADX line under the chart rises too, say from 15 to above 30. These numbers are illustrative.
Now picture the pair falling in the same steady steps. The ADX rises in exactly the same way, because it measures the strength of the move and ignores its direction.
The Average Directional Index (ADX) is an indicator that rates trend strength on a 0 to 100 scale. J. Welles Wilder Jr. published it in 1978, in the same book that introduced the RSI and the Parabolic SAR.
Platforms usually draw it as three lines in a panel below the price chart. The ADX line gives strength, and the default setting is 14 periods.
The +DI (positive directional indicator) tracks upward pressure. The −DI (negative directional indicator) tracks downward pressure.
How is the ADX calculated?
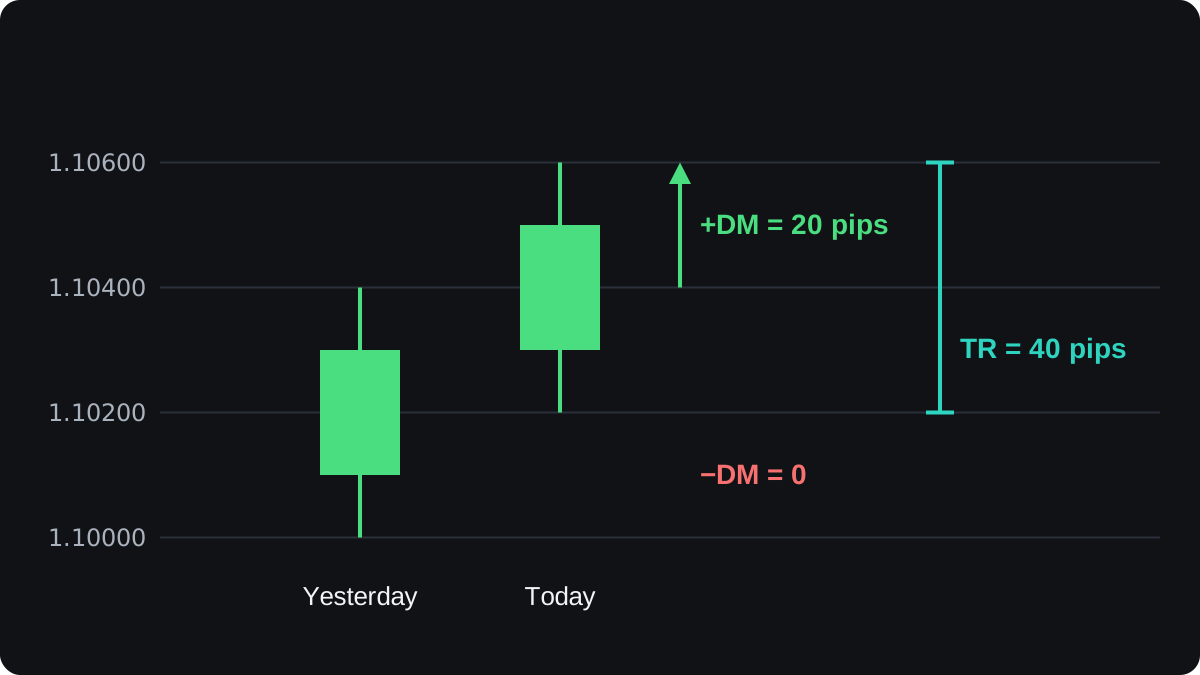
Your platform does the arithmetic, but working one bar by hand shows what the number really measures. The prices below are round illustrative numbers for two daily bars of EUR/USD.
| Bar | High | Low | Close |
|---|---|---|---|
| Yesterday | 1.10400 | 1.10000 | 1.10300 |
| Today | 1.10600 | 1.10200 | 1.10500 |
Step 1: directional movement
Compare the highs, then the lows. Today's high minus yesterday's high is 1.10600 − 1.10400 = 0.00200, or 20 pips.
Yesterday's low minus today's low is 1.10000 − 1.10200 = −0.00200, a negative number.
Only the larger of the two counts, and only if it is above zero. So +DM (positive directional movement) is 20 pips and −DM (negative directional movement) is 0 for this bar.
On a bar that sits inside the previous one, both results are negative, so both count as 0.
Step 2: true range
The true range is the largest of three gaps: today's high to today's low, today's high to yesterday's close, and yesterday's close to today's low. It captures any jump from the previous close.
Here those gaps are 40 pips, 30 pips (1.10600 − 1.10300) and 10 pips (1.10300 − 1.10200). The true range is 40 pips. The same figure feeds the ATR, covered in measuring volatility.
Step 3: the two DI lines
Every bar gives a +DM, a −DM and a true range. Wilder smooths each one with a slow running average set to 14 bars.
Suppose the smoothed totals come to +DM 280 pips, −DM 120 pips and true range 800 pips. Each DI is directional movement as a share of true range:
- +DI = 100 × 280 ÷ 800 = 35
- −DI = 100 × 120 ÷ 800 = 15
Step 4: from DX to ADX
The DX (directional index) is the gap between the two DI lines as a share of their total: DX = 100 × (35 − 15) ÷ (35 + 15) = 100 × 20 ÷ 50 = 40.
The gap is always taken as a positive number. If −DI were the larger line, you would drop the minus sign before dividing.
The ADX is a smoothed average of DX. With Wilder's method, new ADX = (previous ADX × 13 + today's DX) ÷ 14.
If yesterday's ADX was 30, today's is (30 × 13 + 40) ÷ 14 = 430 ÷ 14 = 30.7. A DX of 40 moved the line by only 0.7.
Two rounds of smoothing make the ADX slow. The first value also needs roughly twice the period of history, about 28 bars on the default setting.
Why up and down trends give the same ADX
Swap the two DI values and the DX formula gives the same answer, because it uses the size of the gap and drops the sign.
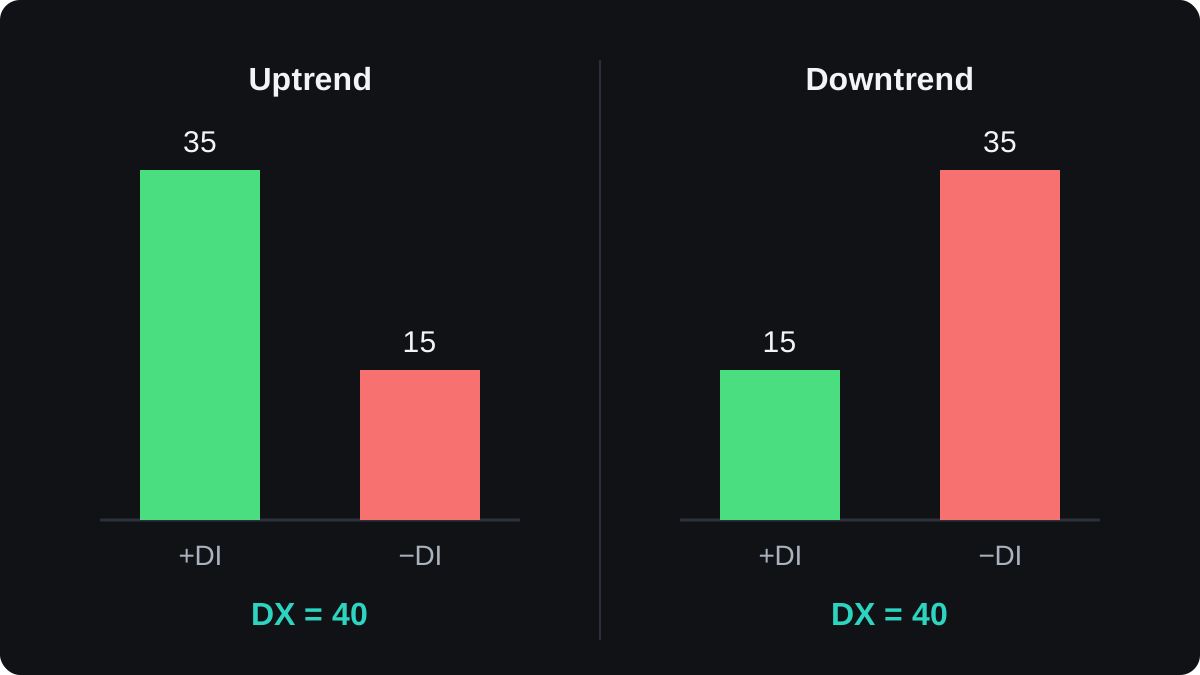
Two nearly equal DI lines give a DX close to zero, which is what a sideways market looks like.
| Market | +DI | −DI | DX |
|---|---|---|---|
| Steady uptrend | 35 | 15 | 40 |
| Steady downtrend | 15 | 35 | 40 |
| Sideways range | 22 | 20 | 4.8 |
For the range, DX = 100 × (22 − 20) ÷ (22 + 20) = 200 ÷ 42 = 4.8. Upward and downward pressure almost cancel, so there is nothing for the ADX to call a trend.
Direction comes from the DI lines themselves. When +DI sits above −DI, recent upward movement has outweighed downward movement. When −DI is on top, the reverse is true.
How do traders read ADX levels?
A common convention reads values below 20 as a weak trend or none, and values above 25 as a trend in place. A reading above 40 is often labelled a strong trend. These cut-offs are habits, and no level is official.
The slope often tells you more than the level. A rising ADX means the latest DX readings are above its average, so one side is pulling further ahead. A falling ADX means that lead is shrinking.
A falling ADX is different from a reversal. An ADX that drops from 40 to 30 can still sit under a clear uptrend that is simply moving more slowly. It can also mean the market is turning into a range.
In the chart below, price trends up and then moves sideways. The ADX climbs past 25 during the trend, peaks near 36 just after the trend ends, and then sinks below 20 in the range.
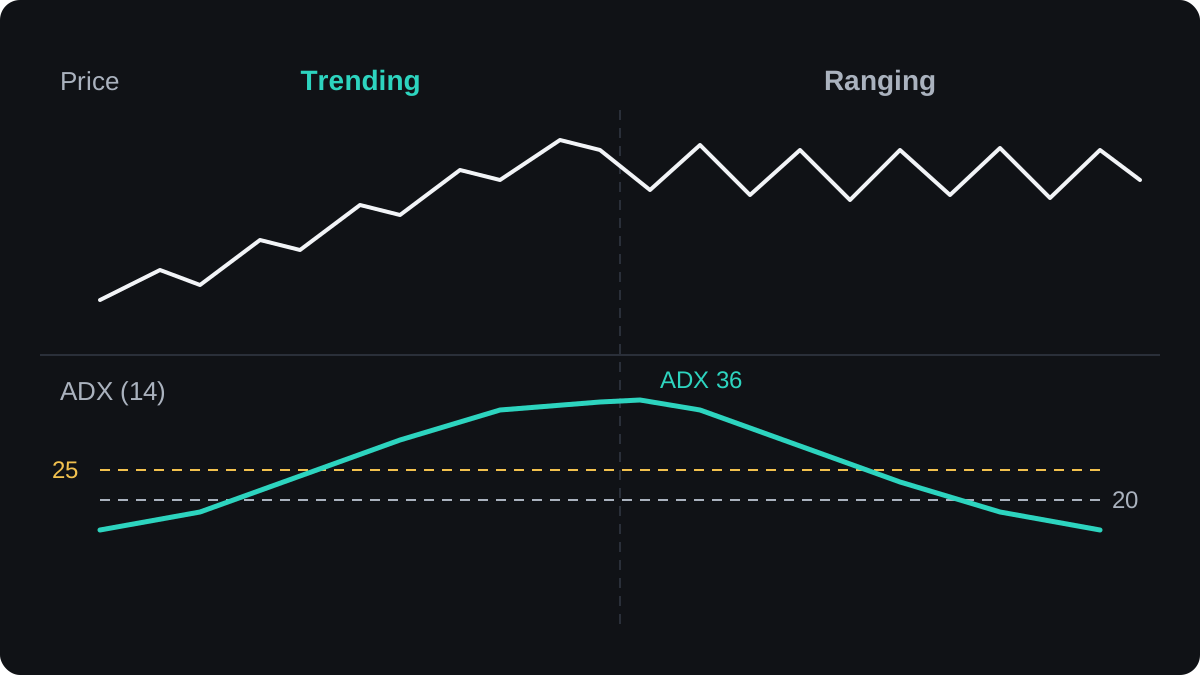
One common use is as a filter. A trader might take moving average crossover signals only when ADX is above 25, and use an oscillator such as the stochastic only when it is below 20.
That is an example of a rule, and it needs testing before anyone relies on it.
Where does the ADX fall short?
The biggest weakness is lag. Each input is smoothed, then the DX is smoothed again, so the ADX often peaks after the strongest part of a move. By then much of the trend may be over.
The thresholds do not travel well between charts. A reading of 25 on a 5-minute chart of a quiet pair says something different from 25 on a daily chart of a volatile one.
Watch how the ADX behaves on your own pair and timeframe before trusting any level.
DI crossovers, where +DI moves above −DI or the reverse, are sometimes used as entry signals. In a sideways market the two lines cross back and forth often, and each cross can turn into a losing trade.
Platforms do not all compute it the same way. Some use a standard exponential average instead of Wilder's smoothing, so two platforms can show slightly different values on the same chart.
The evidence for fixed ADX rules as a stand-alone edge is weak. Treat the ADX as a description of the recent market, and backtest any rule built on it before you trade with it.
The ADX next to other tools
The ADX says whether there is a trend worth following and leaves timing to other tools. The trending versus ranging markets lesson shows how that answer changes which strategy makes sense.
It pairs well with an oscillator because the two measure different things. The RSI looks at the balance of up and down closes, while the ADX looks at the strength of directional movement.
The lesson on combining indicators explains how to avoid stacking tools that repeat each other. The next lesson, Ichimoku Kinko Hyo, puts several trend readings on one chart.
Questions
What is a good ADX value for a trend?
There is no official level. A common convention treats readings above 25 as a trend and below 20 as weak or no trend, and the useful cut-off varies with the pair and timeframe.
Does the ADX show if the price will go up or down?
No. The ADX line measures strength only. The +DI and −DI lines show which side has had more movement recently, and neither predicts the next move.
What is the best ADX period?
14 is the setting Wilder used and most platforms load by default. A shorter period reacts faster and is noisier, and a longer one is smoother and slower.
Why is the ADX falling while the price still rises?
The trend is losing strength, often because the pair is rising more slowly or pausing. A falling ADX on its own is not a sell signal.
What is the difference between ADX and DMI?
DMI, the Directional Movement Index, usually means the +DI and −DI pair, often drawn together with the ADX. Some platforms label the whole three-line panel DMI.
Keep learning
 Chapter 5Bollinger Bands.Bollinger Bands are three lines on a price chart: usually a 20-period simple moving average in the middle, with bands two standard deviations above and below it. The bands widen when price moves a lot and narrow when it is quiet. A narrow stretch, called a squeeze, often comes before a larger move in either direction.
 Chapter 5MACD indicator.MACD, short for moving average convergence divergence, measures the gap between a 12-period and a 26-period exponential moving average of price. A 9-period EMA of that gap forms the signal line, and the histogram shows the difference between the two. It is read as momentum, but it lags price and gives many false signals in ranges.
 Chapter 5Parabolic SAR.Parabolic SAR is a trend indicator that draws a dot for each bar, below price in an uptrend and above it in a downtrend. The dots move closer to price as the trend extends, and when price crosses them they flip sides. It is often used as a trailing stop, and it gives many false flips in sideways markets.
 Chapter 5Stochastic oscillator.The stochastic oscillator shows where the latest close sits within the high to low range of a set number of candles, on a scale of 0 to 100. Readings above 80 are called overbought and below 20 oversold. They describe recent closes near the top or bottom of the range and do not mean price must reverse.
 Chapter 5Relative Strength Index (RSI).The Relative Strength Index (RSI) is a momentum indicator that compares the size of recent gains with recent losses and plots the result from 0 to 100. The default uses 14 candles. Readings above 70 are called overbought and below 30 oversold, but in a strong trend RSI can stay beyond those lines for a long time.
 Chapter 5Ichimoku Kinko Hyo.Ichimoku Kinko Hyo is a Japanese trend indicator with five lines: a 9-period conversion line, a 26-period base line, two leading spans that form a cloud 26 periods ahead, and the close plotted 26 periods back. Price above the cloud is read as an uptrend bias, below it as a downtrend bias.
 Chapter 5How to combine indicators.Combine indicators by giving each one a different job. Use one tool to read the trend's direction or strength, and another to time entries, such as a moving average with RSI. Avoid stacking tools that measure the same thing, like RSI and Stochastic together, because they repeat one signal and only look like confirmation.
 Chapter 5Chart indicators cheat sheet.A chart indicator turns past prices into a number or line. Bollinger Bands measure volatility. MACD, Parabolic SAR and Ichimoku follow trend direction. RSI and the stochastic measure momentum, and ADX measures trend strength. Each has a common signal, and each fails in a predictable kind of market, usually trends for oscillators and ranges for trend tools.

