Relative Strength Index (RSI).
The Relative Strength Index (RSI) is a momentum indicator that compares the size of recent gains with recent losses and plots the result from 0 to 100. The default uses 14 candles. Readings above 70 are called overbought and below 30 oversold, but in a strong trend RSI can stay beyond those lines for a long time.

Suppose EUR/USD closed higher on most of its last 14 candles, and the rises were bigger than the falls. The Relative Strength Index, or RSI, turns that record into one number between 0 and 100, and in this case the number would be high.
J. Welles Wilder introduced RSI in his 1978 book New Concepts in Technical Trading Systems, which also described Parabolic SAR and the ADX. Most trading platforms show it in a panel under the price chart, with lines at 30 and 70.
What does RSI measure?
RSI compares the size of recent gains with the size of recent losses, using closing prices only. It is an oscillator, an indicator that swings between fixed limits, here 0 and 100, in its own panel.
That makes it a measure of momentum, the strength and speed of recent price changes. A reading of 50 means the average gain and the average loss were equal over the period.
Above 50, gains were larger than losses, and below 50, losses were larger. RSI gets close to 100 only when nearly every candle closes higher, and close to 0 only when nearly every candle closes lower.
The name can mislead. In stock analysis, relative strength often compares one market with another, while RSI compares one market with its own recent past.
How is RSI calculated?
The standard setting looks back 14 candles. Take 14 illustrative EUR/USD candles where the rises from one close to the next added up to 84 pips and the falls added up to 42 pips.
- Average gain: 84 ÷ 14 = 6 pips.
- Average loss: 42 ÷ 14 = 3 pips, written as a positive number.
- Divide the average gain by the average loss: 6 ÷ 3 = 2. This ratio is the relative strength, or RS.
- Put RS into the formula RSI = 100 − 100 ÷ (1 + RS): 100 − 100 ÷ 3 = 100 − 33.33 = 66.67, shown as 66.7.
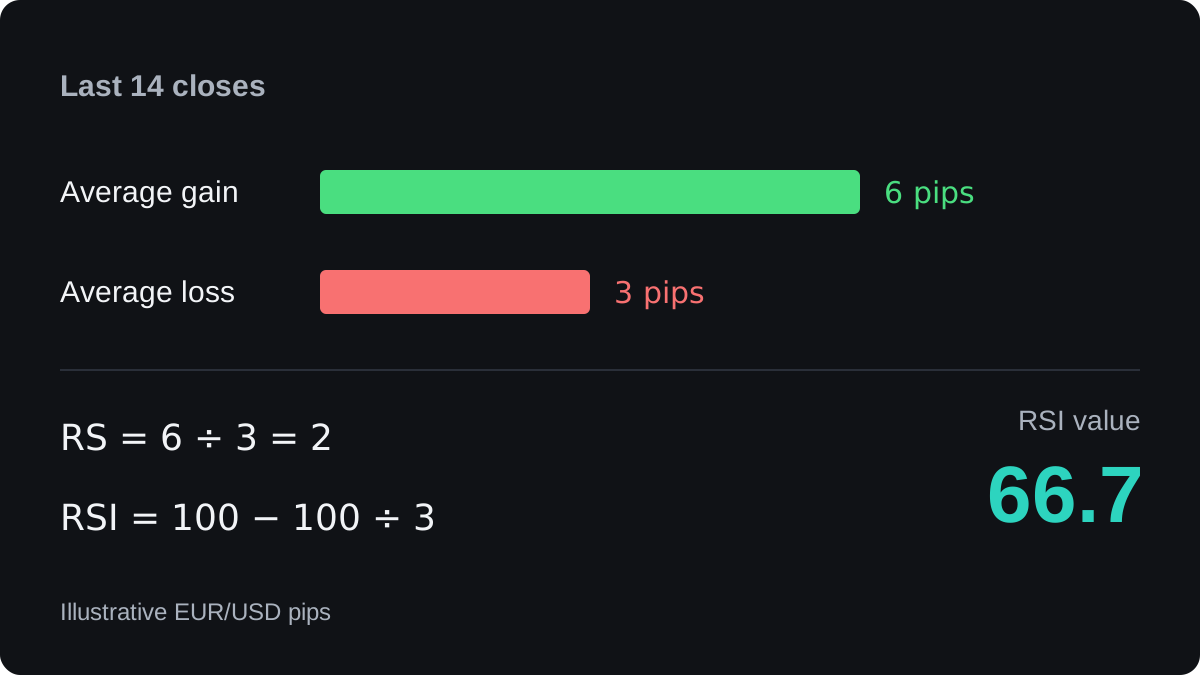
A candle that closes exactly where the previous one closed adds zero to both totals. The units cancel out, so pips, dollars or yen give the same answer: only the ratio of gains to losses matters.
How the next candle changes the reading
The steps above give the first value. After that, Wilder smoothed the averages instead of starting again: new average = (old average × 13 + newest change) ÷ 14.
A close that falls adds 0 to the gain side, and a close that rises adds 0 to the loss side. Say the next close is 10 pips higher:
- Average gain: (6 × 13 + 10) ÷ 14 = 88 ÷ 14 = 6.29 pips.
- Average loss: (3 × 13 + 0) ÷ 14 = 39 ÷ 14 = 2.79 pips.
- RS = 88 ÷ 39 = 2.26, since the two divisions by 14 cancel, so RSI = 100 − 100 ÷ 3.26 = 69.3.
If the next close is 10 pips lower instead:
- Average gain: (6 × 13 + 0) ÷ 14 = 78 ÷ 14 = 5.57 pips.
- Average loss: (3 × 13 + 10) ÷ 14 = 49 ÷ 14 = 3.50 pips.
- RS = 78 ÷ 49 = 1.59, so RSI = 100 − 100 ÷ 2.59 = 61.4.
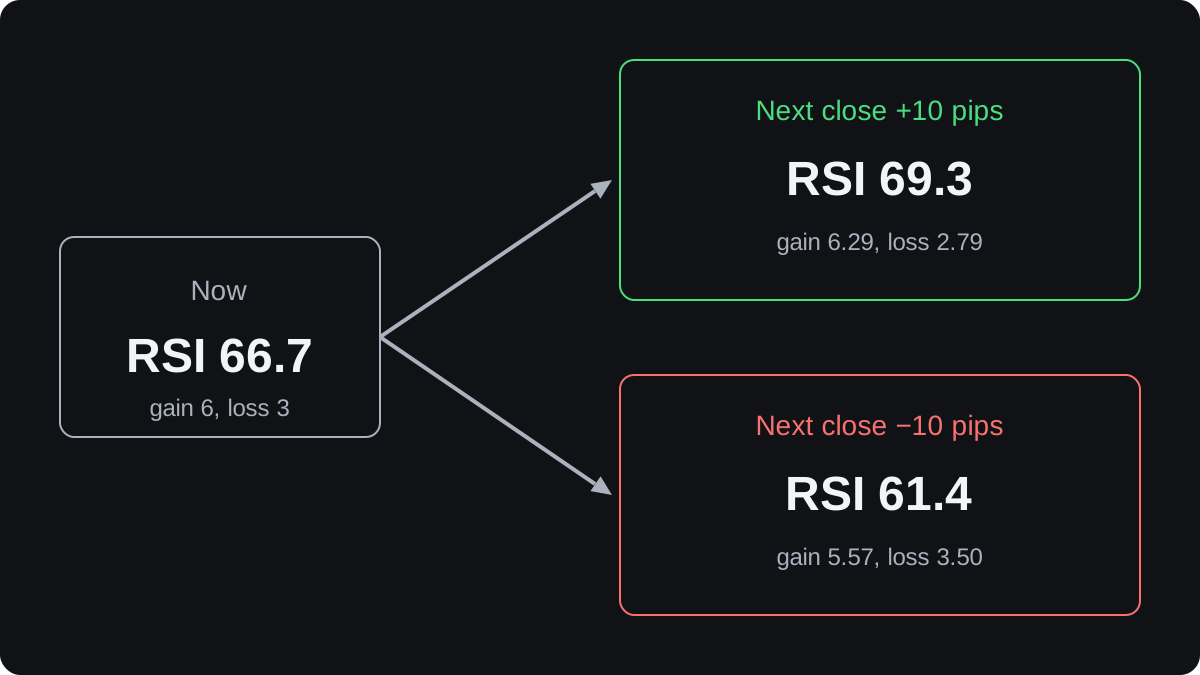
The same 10 pips lifted RSI by about 2.6 points or cut it by about 5 points. Your platform does this arithmetic for you.
Small differences between platforms usually come from how much price history each one starts the smoothing from, or from a different type of average.
How do traders read the 30 and 70 lines?
A reading above 70 is called overbought, and a reading below 30 is called oversold. Wilder suggested these levels, and most platforms draw them by default.
The words claim more than the maths does. Overbought only means gains have far outweighed losses over the last 14 candles. It says nothing about whether the price is too high or due to fall.
In a sideways market, where price swings between a floor and a ceiling, RSI often reaches 70 near the top of the range and 30 near the bottom.
Some traders sell when RSI turns back down through 70 and buy when it turns back up through 30. Others move the lines to 80 and 20, so fewer and more extreme readings count, and each signal still depends on the range holding.
Why RSI can stay overbought in a trend
In a steady uptrend, rises keep outweighing falls, so RSI can sit above 70 for a long time while price keeps climbing. In the illustrative chart below, EUR/USD rises from 1.10100 to 1.10980 over 12 candles, a gain of 88 pips.
RSI crosses 70 on the fifth candle and stays above it for the last 8 candles. A trader who sold every reading above 70 would have been selling into a market that kept going up.
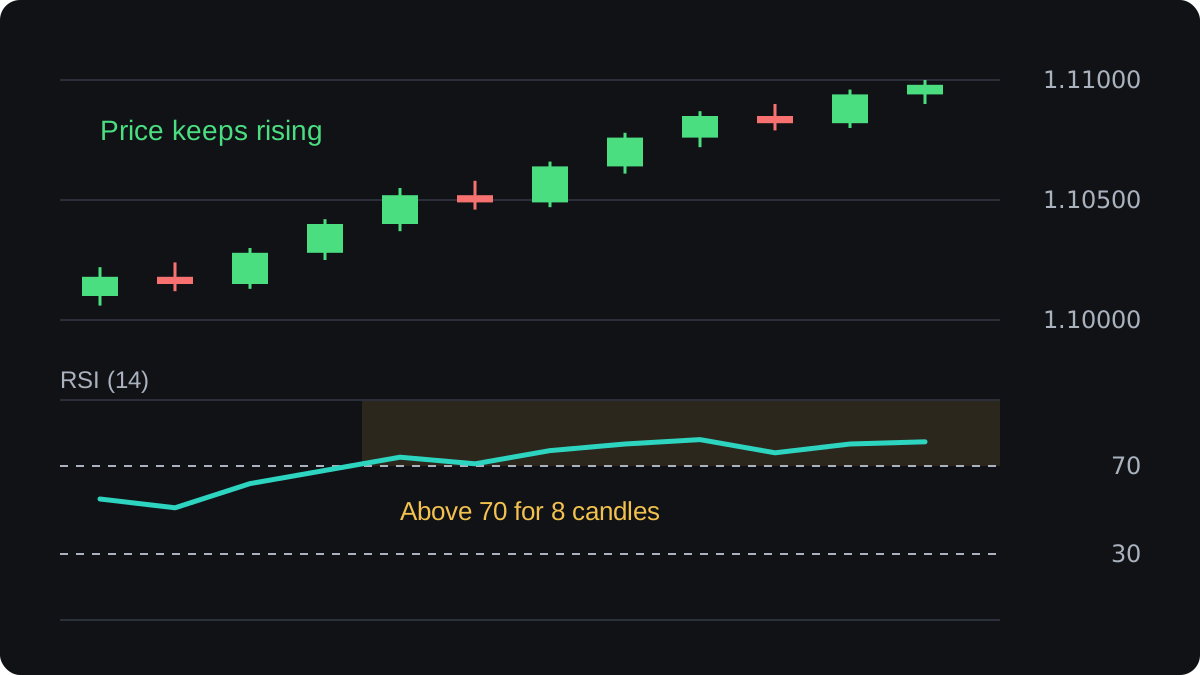
Downtrends do the same in reverse, with RSI staying below 30 while price keeps falling. This is the main way the 30 and 70 rule fails.
The rule assumes price will swing back toward the middle, and a trend can run for many candles without doing that.
There is no solid public evidence that a plain 30 and 70 rule makes money on its own once trading costs are included. Treat it as an idea to backtest on your pair and timeframe before you trust it.
Other ways traders use RSI
The 50 line
Some traders look only for buys while RSI is above 50 and only for sells while it is below. This filters out trades against recent momentum, though it reacts late, because RSI needs several candles to cross 50.
Divergence
Divergence is a gap between what price and RSI are doing. Price makes a higher high while RSI makes a lower high, or price makes a lower low while RSI makes a higher low.
It shows that the latest push had less force behind it. It can also last through several more highs before price turns, if it turns at all. The divergence lessons cover it in detail.
Changing the period
A shorter period, such as 7, reacts faster and reaches 30 and 70 more often, with more false alarms. A longer period, such as 21, is smoother and slower.
The period counts candles on your chart. RSI 14 on a 1-hour chart is built mainly from the last 14 hours, and on a daily chart from the last 14 days.
How is RSI different from the stochastic oscillator?
Both run from 0 to 100 and both mark overbought and oversold zones. The stochastic oscillator asks where the latest close sits inside the high to low range of the period.
RSI asks how large the up-closes were compared with the down-closes. Because they measure different things, the two can disagree on the same chart.
Neither one says how strong a trend is. That is the job of the ADX, covered in the next lesson.
Questions
What is the best RSI setting for forex?
There is no single best setting. The default is 14 candles; shorter periods react faster with more false signals, and longer ones are smoother but slower, so test any setting on the pair and timeframe you trade.
Does RSI above 70 mean you should sell?
No. It means recent gains have far outweighed recent losses, and in a strong uptrend RSI can stay above 70 while price keeps rising.
What does an RSI of 50 mean?
The average gain and the average loss over the period were equal. Recent momentum pointed neither up nor down.
Is RSI a leading or lagging indicator?
RSI is calculated from past closes, so it reacts after price has moved. Divergence is sometimes treated as an early warning, but it can persist for a long time; the lesson on leading and lagging indicators explains the difference.
Keep learning
 Chapter 5Bollinger Bands.Bollinger Bands are three lines on a price chart: usually a 20-period simple moving average in the middle, with bands two standard deviations above and below it. The bands widen when price moves a lot and narrow when it is quiet. A narrow stretch, called a squeeze, often comes before a larger move in either direction.
 Chapter 5MACD indicator.MACD, short for moving average convergence divergence, measures the gap between a 12-period and a 26-period exponential moving average of price. A 9-period EMA of that gap forms the signal line, and the histogram shows the difference between the two. It is read as momentum, but it lags price and gives many false signals in ranges.
 Chapter 5Parabolic SAR.Parabolic SAR is a trend indicator that draws a dot for each bar, below price in an uptrend and above it in a downtrend. The dots move closer to price as the trend extends, and when price crosses them they flip sides. It is often used as a trailing stop, and it gives many false flips in sideways markets.
 Chapter 5Stochastic oscillator.The stochastic oscillator shows where the latest close sits within the high to low range of a set number of candles, on a scale of 0 to 100. Readings above 80 are called overbought and below 20 oversold. They describe recent closes near the top or bottom of the range and do not mean price must reverse.
 Chapter 5Average Directional Index (ADX).The Average Directional Index (ADX) measures how strong a trend is on a scale of 0 to 100, without saying which way it points. Readings above about 25 are commonly read as a trending market and below about 20 as a weak or ranging one. Two companion lines, +DI and −DI, show direction.
 Chapter 5Ichimoku Kinko Hyo.Ichimoku Kinko Hyo is a Japanese trend indicator with five lines: a 9-period conversion line, a 26-period base line, two leading spans that form a cloud 26 periods ahead, and the close plotted 26 periods back. Price above the cloud is read as an uptrend bias, below it as a downtrend bias.
 Chapter 5How to combine indicators.Combine indicators by giving each one a different job. Use one tool to read the trend's direction or strength, and another to time entries, such as a moving average with RSI. Avoid stacking tools that measure the same thing, like RSI and Stochastic together, because they repeat one signal and only look like confirmation.
 Chapter 5Chart indicators cheat sheet.A chart indicator turns past prices into a number or line. Bollinger Bands measure volatility. MACD, Parabolic SAR and Ichimoku follow trend direction. RSI and the stochastic measure momentum, and ADX measures trend strength. Each has a common signal, and each fails in a predictable kind of market, usually trends for oscillators and ranges for trend tools.

