Trading with Elliott Wave counts.
Trading with an Elliott Wave count means using the labels to set three prices: an entry after a correction ends, a stop at the level where the count breaks a rule, and a target from Fibonacci guidelines. Counts are subjective and change often, so the invalidation level matters more than the forecast.
Ce contenu n'existe pour l'instant qu'en anglais.

A wave count is a forecast, and forecasts are often wrong. What makes a count useful for trading is that it also names the exact price at which it would be wrong. That price is where your stop goes.
This lesson builds on Elliott Wave theory, impulse waves and corrective waves. Every price below is illustrative, chosen to keep the arithmetic easy to follow.
What does a wave count give a trader?
Say you label a rise on EUR/USD as wave 1 and the dip after it as wave 2. If you are right, wave 3, often the strongest leg, may be about to start. If you are wrong, the pattern was something else.
A count turns that idea into three prices. The entry is where you join the next expected wave. The target comes from Fibonacci ratios that waves sometimes follow.
The stop sits at the invalidation level: the price at which the count would break one of Elliott's rules. Past that price, your reason for the trade no longer exists.
The stop and the target do not carry equal weight. The stop rests on a rule that holds by definition. The target rests on a habit of the market that may not repeat this time.
Which rules make a count invalid?
An impulse, the five-wave move in the direction of the trend, has only three hard rules. Everything else in the method is a guideline.
- Wave 2 never moves beyond the start of wave 1.
- Wave 3 is never the shortest of waves 1, 3 and 5.
- Wave 4 does not enter the price range of wave 1.
Each rule gives you a price. In a rising impulse, a fall below the start of wave 1 ends the count during wave 2. A fall below the top of wave 1 ends it during wave 4.
The third rule has one exception. In a diagonal, a wedge-shaped five-wave pattern, wave 4 may overlap wave 1. When overlap appears, you either relabel the move as a diagonal or drop the count, and either way the original trade idea has changed.
The guidelines below come from Fibonacci retracement and extension levels. Use them as rough zones, since real waves often miss them.
| Wave | Common guideline | Hard rule |
|---|---|---|
| 2 | Retraces 50% to 61.8% of wave 1 | Cannot pass the start of wave 1 |
| 3 | About 161.8% of wave 1 | Cannot be the shortest of 1, 3 and 5 |
| 4 | About 38.2% of wave 3 | Cannot enter the range of wave 1 |
| 5 | About equal to wave 1 | None of its own |
How do you trade the start of wave 3?
Here is a full long trade on EUR/USD, where one pip is 0.0001.
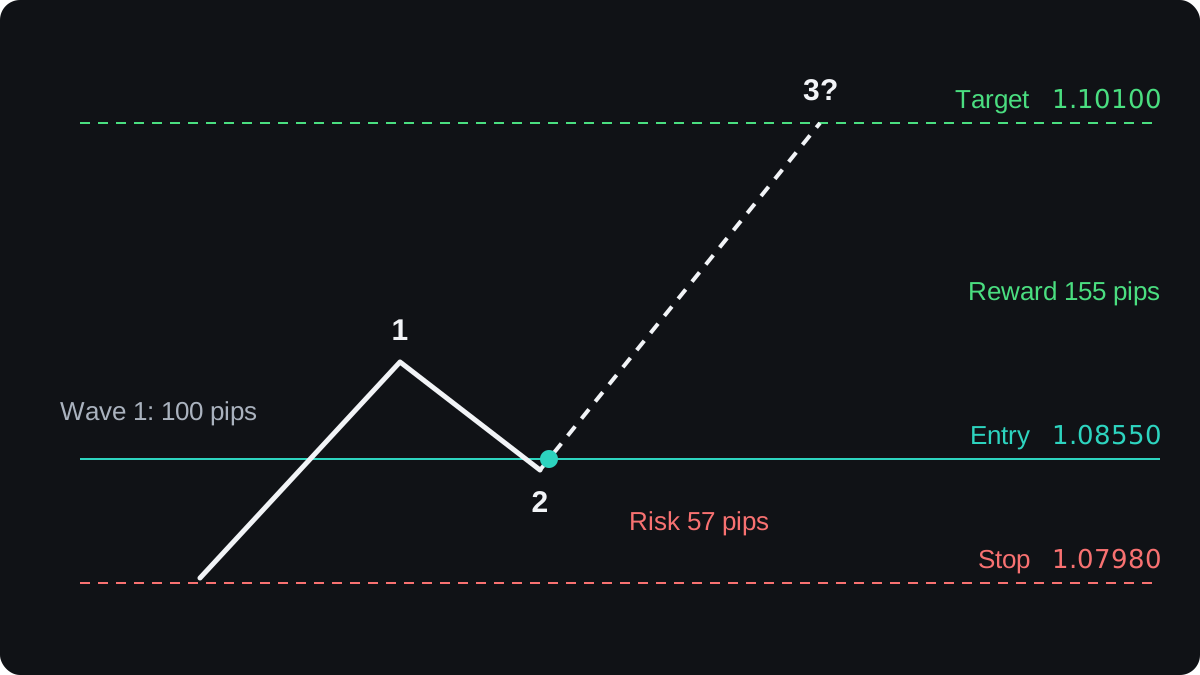
- Wave 1 rises from 1.08000 to 1.09000, a move of 100 pips.
- Wave 2 falls to 1.08500, a retracement of 50 pips, which is 50% of wave 1.
- Price turns up and you buy at 1.08550.
- The stop goes just below the start of wave 1, at 1.07980. Risk is 1.08550 minus 1.07980 = 0.00570, or 57 pips.
- The target is wave 3 at 161.8% of wave 1, which is 161.8 pips. Added to the wave 2 low, 1.08500 + 0.01618 = 1.10118.
- You set the take-profit at 1.10100, a little short of the projection, so it can fill if price stalls just below it.
- Reward is 1.10100 minus 1.08550 = 0.01550, or 155 pips. The reward-to-risk ratio is 155 ÷ 57 = 2.72.
Next comes the size. With a $5,000 account and a plan to risk 1%, you can afford to lose $50. Divide by the 57 pip stop and you get $0.877 per pip.
One standard lot of EUR/USD is worth $10 a pip, so that is 0.0877 lot. Round down to 0.08 lot, worth $0.80 a pip. The trade then risks 57 × $0.80 = $45.60 to make 155 × $0.80 = $124.00.
The position size lesson explains this step in full, including why a wide stop calls for a smaller position.
A tighter stop, say at 1.08300, would sit inside the zone where the count is still valid. Normal swings could close the trade while the idea is intact.
The target makes no promise either. Wave 3 might stop at 100% of wave 1 or run to 261.8%, and the rule only says it cannot be the shortest of the three impulse waves.
How do you trade wave 4 and wave 5?
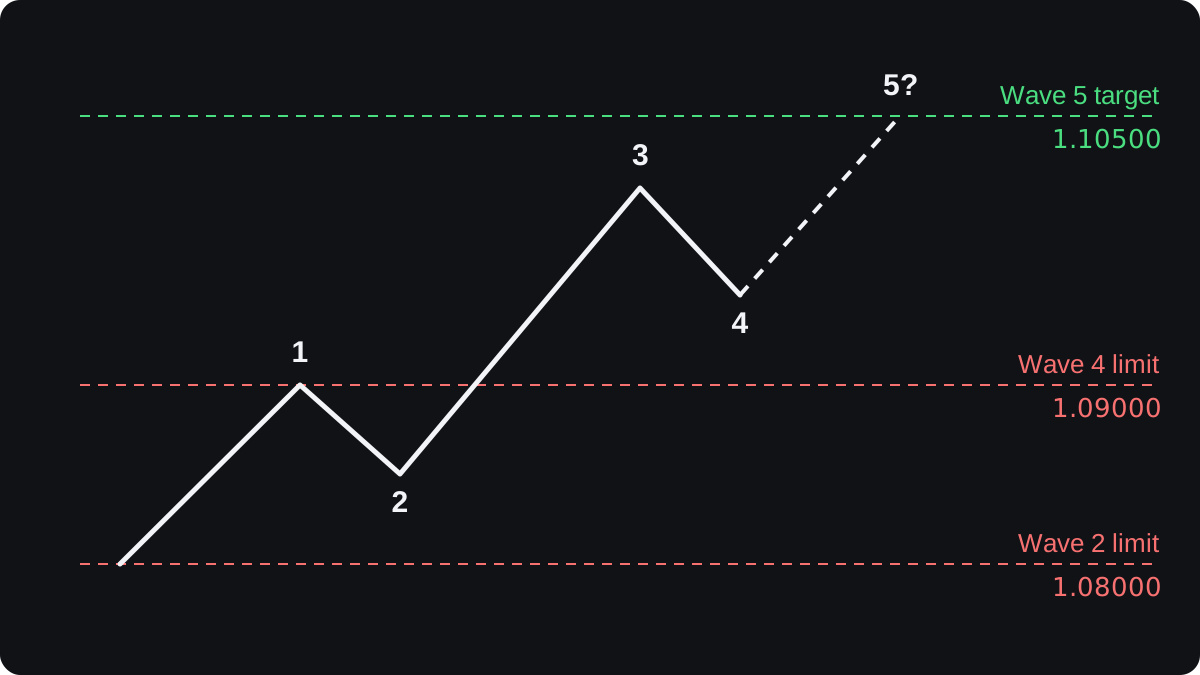
Suppose wave 3 does end at 1.10100, a rise of 160 pips from 1.08500. Wave 4 then pulls back to 1.09500. That 60 pip drop is 37.5% of wave 3, close to the 38.2% guideline.
A second long now has a new invalidation level, the top of wave 1 at 1.09000. Below it, wave 4 would overlap wave 1 and the impulse count would break.
- You buy at 1.09550 as price turns up.
- The stop goes at 1.08980. Risk is 1.09550 minus 1.08980 = 0.00570, or 57 pips.
- The target assumes wave 5 equals wave 1, so 100 pips above 1.09500 gives 1.10500.
- Reward is 1.10500 minus 1.09550 = 0.00950, or 95 pips. The ratio is 95 ÷ 57 = 1.67.
The fifth wave usually offers less room than the third, and it is the last leg of the pattern. After it, the count expects a correction against the whole move.
Some traders try to sell at the end of wave 5. That is a bet against the trend on a turning point, and wave 5 can extend well past a target equal to wave 1.
Why do wave counts change so often?
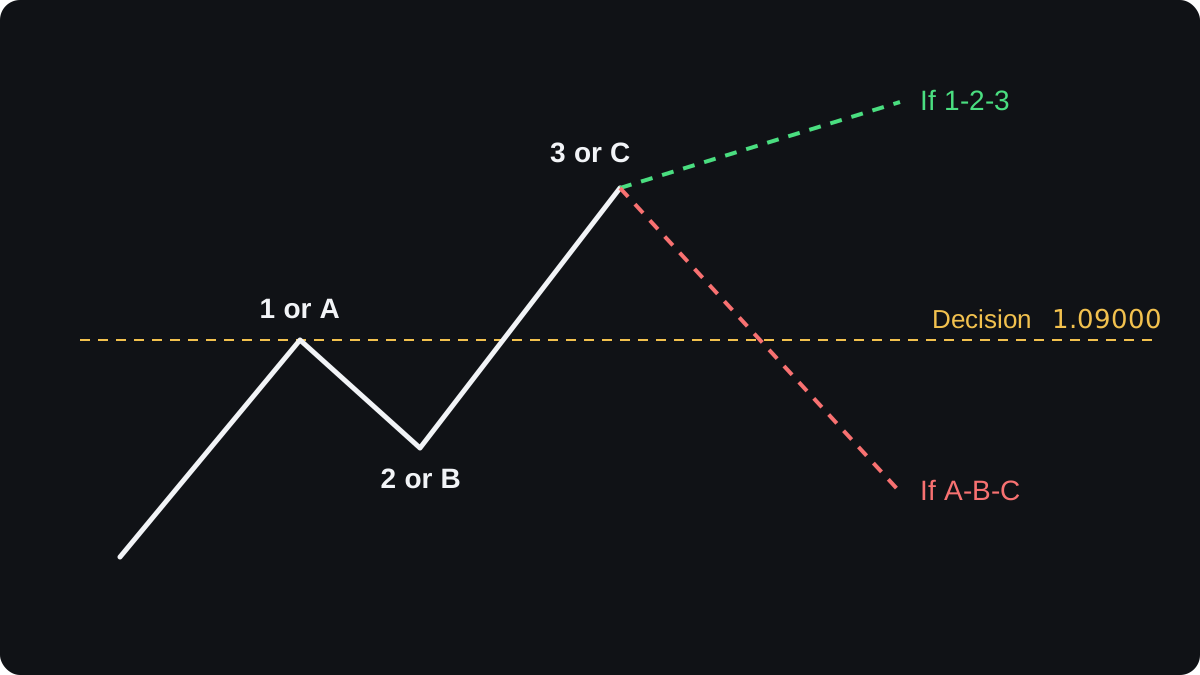
One chart can hold more than one valid count. A rise from 1.08000 to 1.09000, back to 1.08500, then up to 1.09700 could be waves 1, 2 and 3 of an impulse. It could also be a finished A-B-C correction inside a larger fall.
The two counts predict opposite things. As waves 1 to 3, the move still has a fourth and fifth wave to come. As A-B-C, the rise is over and price may fall back.
Price can rule one count out. A drop below 1.09000, the top of the first leg, would be overlap, which rules out the fourth wave of a normal impulse and favours A-B-C. Until then, both counts stay alive.
Waves also come in degrees, the size level of a wave. A move you call wave 3 on a 4-hour chart contains its own smaller waves on a 15-minute chart, and an extended wave can make those smaller waves look like main ones.
Elliott Wave is subjective. Two careful analysts can label the same chart differently, and a count often looks obvious only after the move has finished.
Independent evidence that wave counts forecast better than chance is thin. Use a count mainly to decide where a trade idea fails, and expect to relabel often.
How can you keep a count honest?
Write down the primary count and one alternate before you trade, each with its invalidation price. If price reaches that level, the count is wrong, whatever you expected.
Let the invalidation level set the stop, then let the stop set the size. Moving the stop to save a count is how a small planned loss becomes a large one.
A wave 2 low that also sits on support gives you two reasons for the same level. Agreement does not guarantee anything, but it makes a count less arbitrary.
Test the method before risking money. Label past charts with the right side hidden, then check how often your stops were hit. The backtesting lesson shows how to avoid fooling yourself with hindsight.
Questions fréquentes
Where do you put a stop loss with Elliott Wave?
At the price that would break the count. When trading after wave 2, that is just beyond the start of wave 1. After wave 4, it is just beyond the end of wave 1.
Which Elliott wave is best to trade?
Wave 3 is a common choice because its invalidation level is clear and it cannot be the shortest impulse wave. That does not make it profitable, because the count itself may be wrong.
How accurate is Elliott Wave?
There is no reliable accuracy figure. Counts are subjective and change as price develops, and strong independent evidence of forecasting skill is lacking.
What happens when a wave count is invalidated?
Your stop closes the trade and you recount the chart. Often the alternate count you wrote down becomes the new primary count.
Can you use Elliott Wave on any timeframe?
Elliott described waves at many degrees, from short intraday swings to moves lasting decades. Shorter timeframes contain more small swings, so there are more ways to label them and counts change more often.
Continuer à apprendre
 Chapitre 2What is Elliott Wave theory?Elliott Wave theory says prices move in repeating patterns driven by crowd mood. A trend unfolds in five waves, three with the trend and two against it, then corrects in three waves labelled A, B and C. The same pattern appears at every scale. Counting waves is subjective, and evidence that it predicts prices is weak.
 Chapitre 2Impulse waves: the five-wave move.An impulse is the five-wave move that carries an Elliott Wave trend: waves 1, 3 and 5 go with the trend and waves 2 and 4 pull back. It must pass three rules: wave 2 never goes past the start of wave 1, wave 3 is never the shortest trend wave, and wave 4 never enters wave 1's price range.
 Chapitre 2Corrective waves: zigzags, flats and triangles.Corrective waves are the moves against the trend in Elliott Wave theory, labelled with letters. The three basic shapes are the zigzag (5-3-5, sharp and deep), the flat (3-3-5, sideways, with wave B retracing about 90% of A or more) and the triangle (five legs, A to E, usually narrowing). Corrections can also join into combinations.
Courtiers partenaires

