What is Elliott Wave theory?
Elliott Wave theory says prices move in repeating patterns driven by crowd mood. A trend unfolds in five waves, three with the trend and two against it, then corrects in three waves labelled A, B and C. The same pattern appears at every scale. Counting waves is subjective, and evidence that it predicts prices is weak.
Ce contenu n'existe pour l'instant qu'en anglais.

Look at almost any price chart and you will see the market move in surges and pullbacks. It seldom moves in a straight line.
Elliott Wave theory claims those surges and pullbacks follow a repeating shape, and it gives you labels and rules for describing it.
It is one of the older schools of technical analysis, and one of the most argued about.
Where does Elliott Wave theory come from?
Ralph Nelson Elliott, an American accountant, studied decades of US stock market data in the 1930s. He concluded that prices moved in recurring wave patterns and set out the idea in a short book, The Wave Principle, in 1938.
His explanation was crowd psychology. Investors as a group swing between hope and fear, and Elliott believed those swings repeat in a recognisable rhythm in any freely traded market.
The theory was written for stocks. The same reasoning is now applied to currency pairs, gold and indices, on the view that any market moved by a crowd can be counted.
What does the five-three pattern look like?
Take an illustrative rally on EUR/USD. Price climbs from 1.08000 to 1.09500 in five legs, then gives back part of the move in three legs.
The five legs in the direction of the trend are called an impulse, labelled 1 to 5. Waves 1, 3 and 5 move with the trend. Waves 2 and 4 are pullbacks against it.
The three legs that follow are a correction, labelled A, B and C. Waves A and C move against the trend, and wave B is a partial bounce between them.
Each move is measured in pips, where one pip on EUR/USD is 0.0001. Wave 1, for example, is 1.08600 minus 1.08000 = 0.00600, which is 60 pips. The prices are round illustrative numbers.
| Wave | From | To | Move |
|---|---|---|---|
| 1 | 1.08000 | 1.08600 | +60 pips |
| 2 | 1.08600 | 1.08300 | -30 pips |
| 3 | 1.08300 | 1.09400 | +110 pips |
| 4 | 1.09400 | 1.09000 | -40 pips |
| 5 | 1.09000 | 1.09500 | +50 pips |
| A | 1.09500 | 1.09000 | -50 pips |
| B | 1.09000 | 1.09250 | +25 pips |
| C | 1.09250 | 1.08750 | -50 pips |
The whole impulse runs 1.09500 minus 1.08000 = 0.01500, or 150 pips. The correction gives back 1.09500 minus 1.08750 = 0.00750, or 75 pips, which is exactly half the impulse.
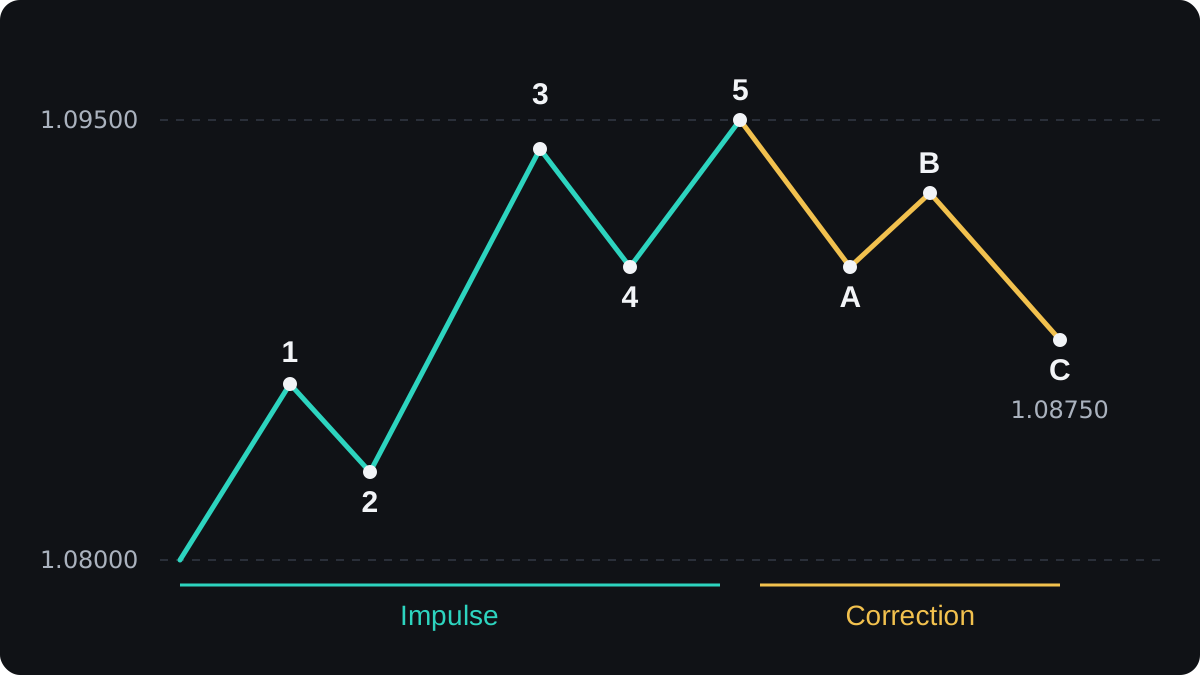
In a falling market the pattern flips, with five waves down and three waves up. The labels and rules stay the same, and the next lesson on impulse waves looks at each of the five legs in turn.
Which rules must a wave count obey?
The framework has many guidelines but only three hard rules for an impulse. Break one and the count is wrong, so the analyst has to label the waves another way.
- Wave 2 never moves past the start of wave 1. Here wave 2 ends at 1.08300, which is 30 pips above the 1.08000 start, so it passes.
- Wave 3 is never the shortest of waves 1, 3 and 5. Here wave 3 is 110 pips against 60 and 50, so it passes.
- Wave 4 never enters the price range of wave 1. Here wave 4 ends at 1.09000, which is 40 pips above the wave 1 top of 1.08600, so it passes.
Wave 2 retraced 30 of wave 1's 60 pips, which is 30 ÷ 60 = 50%. The first rule allows any retracement short of 100%.
Now suppose wave 4 had fallen to 1.08500 instead. That is 1.08600 minus 1.08500 = 0.00100, or 10 pips inside wave 1's range, so that low cannot be labelled wave 4.
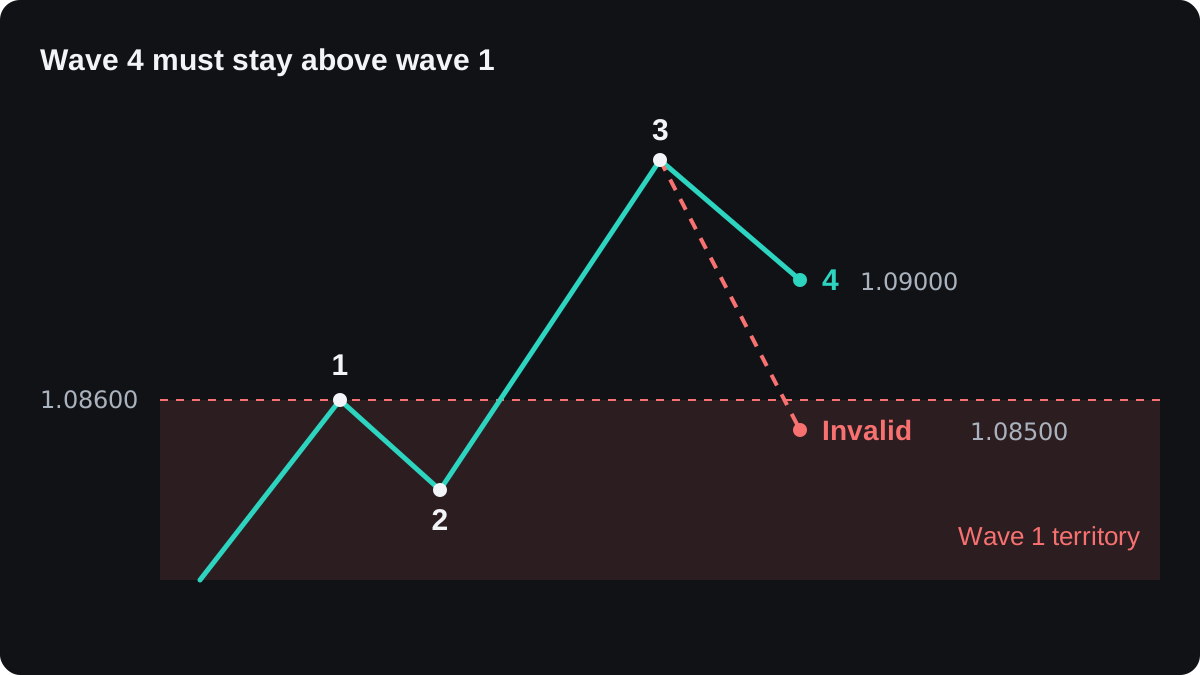
The third rule has one accepted exception, a wedge-shaped pattern called a diagonal, in which waves 1 and 4 may overlap. The next lesson covers it.
A rule cannot tell you where a wave will end. It can tell you when a count has failed, at a price you know in advance, and that is the most testable part of the theory.
Why do waves contain smaller waves?
Zoom into wave 1 on a shorter timeframe and it often looks like a five-wave impulse of its own. Zoom into wave 2 and it can split into three smaller legs.
This scale is called the degree of a wave. Every wave belongs to a larger wave and holds smaller ones, so the pattern is said to repeat from monthly charts down to minute charts.
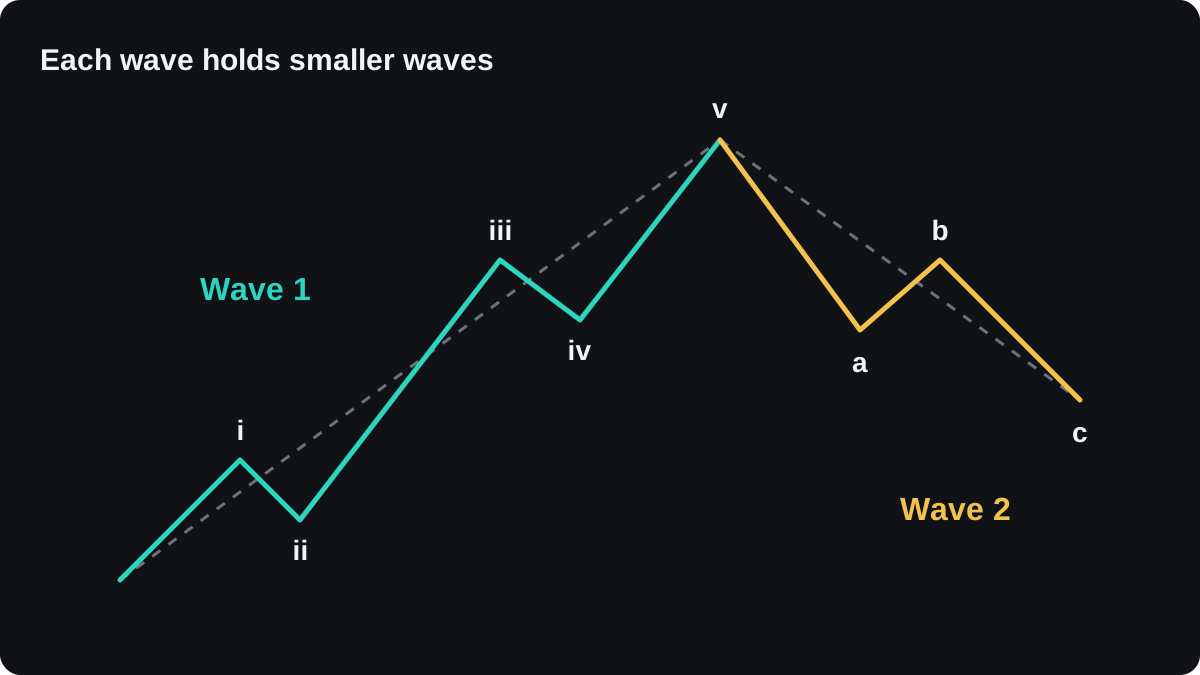
The classic list names nine degrees, from Grand Supercycle, the largest, down to Subminuette. Analysts mark degree with different label styles, such as (1) and i, so that two scales can share one chart.
In the classic textbook diagram, counted one degree lower, the impulse holds 21 smaller waves and the correction holds 13, making 34. Those are Fibonacci numbers, which is part of why the theory is tied so closely to Fibonacci.
The practical effect is that the wave you think the market is in depends on your timeframe. A trader on a 5 minute chart and one on a daily chart can both count correctly and still disagree.
How does Fibonacci fit in?
Elliott linked his waves to the Fibonacci sequence. Analysts who use the method often compare wave lengths with Fibonacci ratios, as covered in the Fibonacci retracement lesson.
Common reference points are a wave 2 that retraces 50% or 61.8% of wave 1, and a wave 3 that reaches 1.618 times the length of wave 1.
In the example, 1.618 × 60 pips = 97.08 pips. Added to the wave 2 low of 1.08300, that projects wave 3 to about 1.09271.
The actual wave 3 ran 110 pips to 1.09400, which is 110 ÷ 60 = 1.83 times wave 1.
These ratios are guidelines. A wave can stop short of them or run past them, and the count stays valid as long as the three rules hold.
Where does Elliott Wave theory fall short?
The biggest problem is subjectivity. Two analysts can label the same chart differently, and both counts may pass all three rules.
Counts are clearest after the fact. While a move unfolds, a pullback could be wave 2, wave 4 or the start of a correction, and often you only learn which much later.
When a count breaks, the usual response is to switch to an alternative count. That keeps the framework flexible, and it also makes the theory hard to prove wrong.
Because counting is a judgement call, it is hard to code and backtest. Independent evidence that wave counts forecast prices better than simpler methods is weak, so treat any count as one opinion about structure.
Markets also spend long stretches moving sideways, where no clean five-wave shape appears. The lesson on trending and ranging markets explains how to tell the two apart.
What the method does give you is a vocabulary for trends and pullbacks, and invalidation prices fixed by the rules. The lesson on trading with Elliott Wave counts shows how traders use those levels, and where that goes wrong.
Questions fréquentes
Does Elliott Wave theory work in forex?
It can be applied to currency pairs like any freely traded market. There is little independent evidence that it predicts prices reliably, and different analysts often produce different counts on the same chart.
What are the 5 waves in Elliott Wave theory?
Waves 1, 3 and 5 move with the trend and waves 2 and 4 move against it. Together they form an impulse, which is followed by a three-wave correction labelled A, B and C.
What are the three rules of Elliott Wave?
Wave 2 never moves past the start of wave 1, wave 3 is never the shortest of waves 1, 3 and 5, and wave 4 never enters wave 1's price range. A diagonal is the one accepted exception to the third rule.
Is Elliott Wave good for beginners?
It is harder to apply than it first looks, because one chart can support several valid counts. Learning to read swing highs and swing lows first makes waves easier to see.
Continuer à apprendre
 Chapitre 2Impulse waves: the five-wave move.An impulse is the five-wave move that carries an Elliott Wave trend: waves 1, 3 and 5 go with the trend and waves 2 and 4 pull back. It must pass three rules: wave 2 never goes past the start of wave 1, wave 3 is never the shortest trend wave, and wave 4 never enters wave 1's price range.
 Chapitre 2Corrective waves: zigzags, flats and triangles.Corrective waves are the moves against the trend in Elliott Wave theory, labelled with letters. The three basic shapes are the zigzag (5-3-5, sharp and deep), the flat (3-3-5, sideways, with wave B retracing about 90% of A or more) and the triangle (five legs, A to E, usually narrowing). Corrections can also join into combinations.
 Chapitre 2Trading with Elliott Wave counts.Trading with an Elliott Wave count means using the labels to set three prices: an entry after a correction ends, a stop at the level where the count breaks a rule, and a target from Fibonacci guidelines. Counts are subjective and change often, so the invalidation level matters more than the forecast.
Courtiers partenaires

