What are oscillators?
An oscillator is an indicator that moves back and forth inside a fixed range such as 0 to 100, or around a centre line such as zero. It compares the latest price with recent prices. A high reading means price is near the top of its recent range, and does not mean price must fall.
Ce contenu n'existe pour l'instant qu'en anglais.

Under many price charts sits a second panel with a line that rises and falls between two limits, often 0 and 100. That line is an oscillator.
It shows where the latest price sits compared with recent prices. The labels traders attach to its extremes often promise more than that.
What does an oscillator measure?
The previous lesson sorted indicators into leading and lagging. Oscillators are often filed in the first group, yet every one of them is calculated from prices that have already printed.
An oscillator is an indicator that turns recent price action into a number moving back and forth within a range or around a centre line.
Most oscillators take a setting called the period, the number of candles in the calculation. A common default is 14.
The stochastic oscillator shows the idea most clearly. Its main line, %K, asks how far up the recent range the last candle closed:
%K = (close minus lowest low) ÷ (highest high minus lowest low) × 100
Here is a worked example with round illustrative prices on EUR/USD, where a pip is 0.0001:
- Over the last 14 candles, the highest high is 1.10500 and the lowest low is 1.10000.
- The range is 1.10500 minus 1.10000 = 0.00500, or 50 pips.
- The last candle closes at 1.10400, which is 0.00400, or 40 pips, above the low.
- %K = 40 ÷ 50 × 100 = 80.
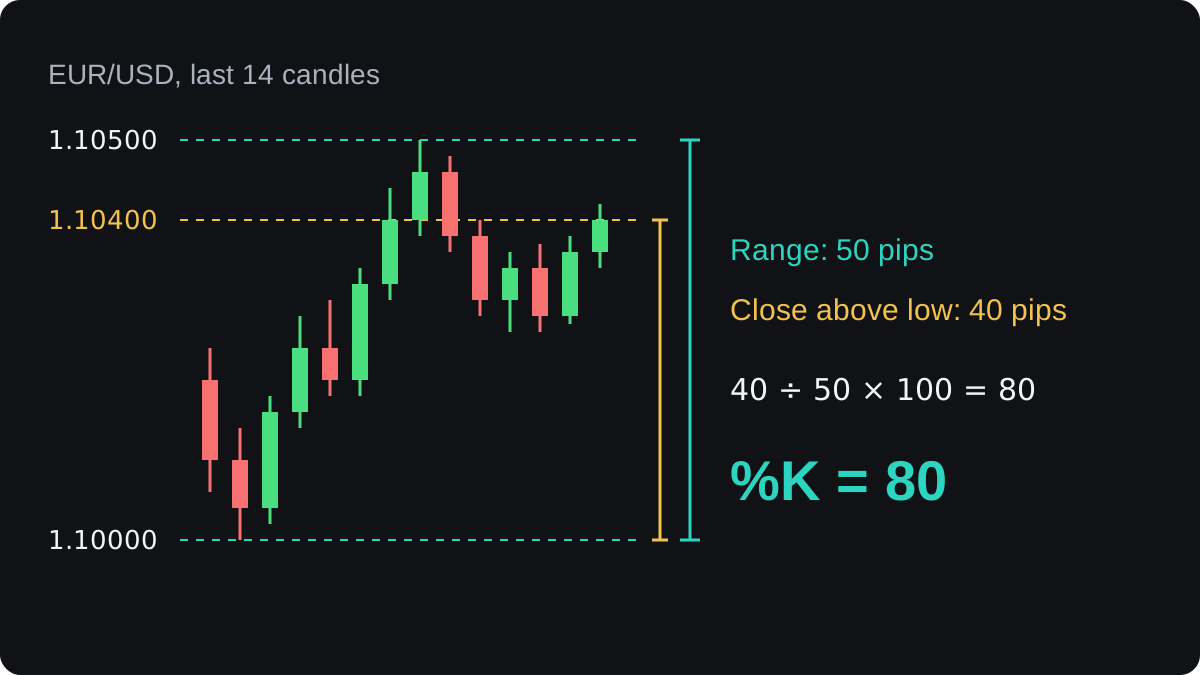
A reading of 80 means the close sits 80% of the way up the 14-candle range. Had the candle closed at 1.10050 instead, the reading would be 5 ÷ 50 × 100 = 10, close to the bottom.
How do bounded and centred oscillators differ?
Oscillators come in two families. A bounded oscillator cannot leave its range, whatever the price does. The stochastic and the RSI both run from 0 to 100.
A centred oscillator has no ceiling or floor. It swings above and below a middle value, usually zero. MACD is the best known example: it is positive when a faster moving average sits above a slower one.
| Oscillator | Range | Usual reference lines |
|---|---|---|
| Stochastic | 0 to 100 | 80 and 20 |
| RSI | 0 to 100 | 70 and 30 |
| Williams %R | 0 to -100 | -20 and -80 |
| CCI | No fixed limit | +100 and -100 |
| MACD | No fixed limit | Zero |
Williams %R is the stochastic turned upside down. With the same period, it equals the unsmoothed %K minus 100, so the reading of 80 in the example would show as -20.
A centred oscillator has no fixed extreme. Its size depends on how far the price itself moves, so a MACD value that looks large on one pair or timeframe can be ordinary on another.
What do overbought and oversold mean?
On a bounded oscillator, readings near the top are called overbought and readings near the bottom oversold. For the RSI, the usual lines are 70 and 30, the levels its creator J. Welles Wilder suggested.
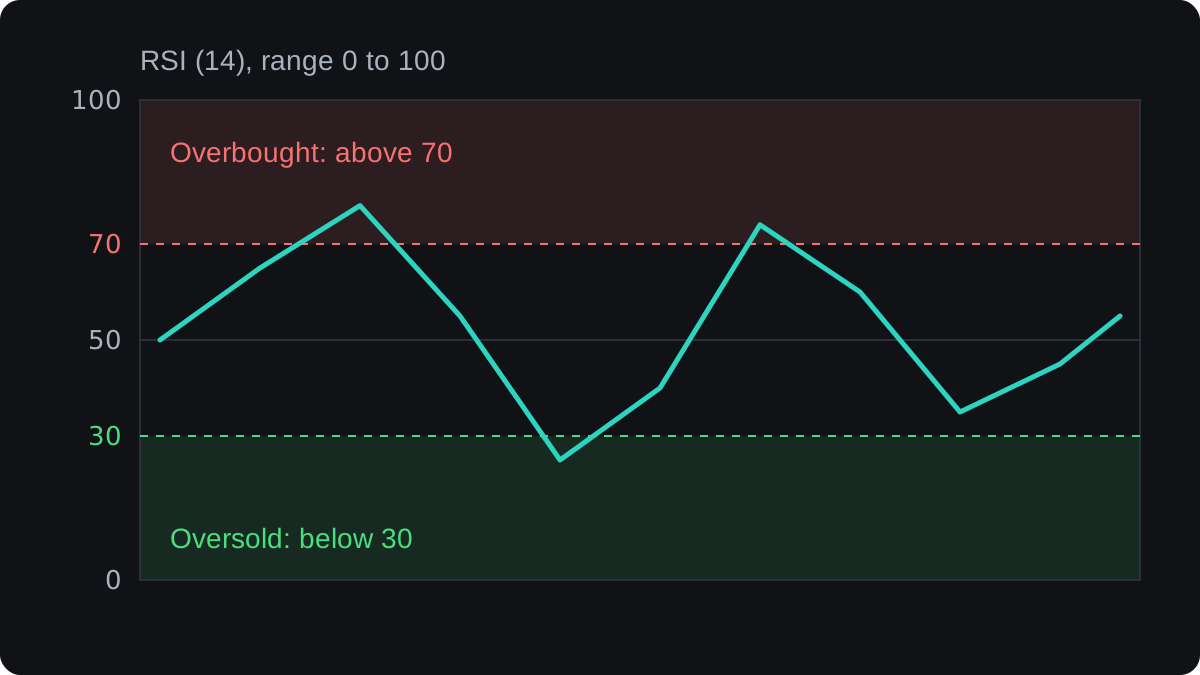
The stochastic is more often drawn with lines at 80 and 20. On either indicator, the zones describe recent closes and nothing more.
An RSI above 70 says recent closes have been strong over the chosen period. It says nothing about fair value, and nothing about whether buyers have run out.
The lines themselves are conventions. You can move the RSI lines to 80 and 20 so that fewer readings count as extreme. The market does not change when you do this, only the number of signals you see.
Why extremes can last in a strong trend
Go back to the EUR/USD example, where %K read 80 at 1.10400. Suppose the next candle rises and closes at its high of 1.10600, the highest price in the period.
The close is now the top of the range, so close minus lowest low equals the whole range, and %K = 100. If the candle after that closes at its high of 1.10700, %K is 100 again.
A trader who sold at 1.10400 because the reading said overbought would now be 30 pips behind before the spread, since 1.10700 minus 1.10400 = 0.00300. The oscillator would still say overbought.
Picture a steadier uptrend where EUR/USD climbs 100 pips, from 1.10000 to 1.11000. Each dip is shallow, so closes stay near the top of the range and the stochastic stays above 80 for most of the move.
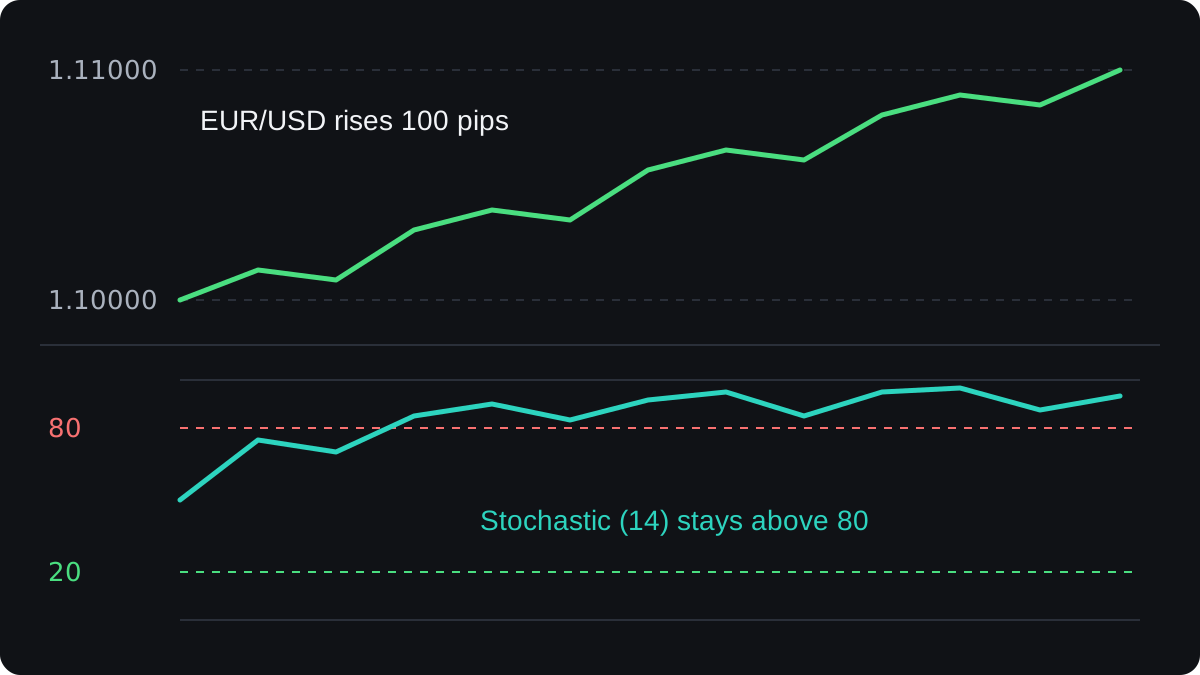
Extreme readings tend to line up with turns more often in a sideways market, where price keeps reversing near the edges of its range. The lesson on trending and ranging markets shows how to tell the two apart.
What traders do with an oscillator once a trend is running is the subject of the next lesson, using oscillators when the market trends.
How the period changes the reading
The period decides how much history the oscillator compares against. A short period uses a narrow range, so each new candle moves the line further and extremes come more often.
Take the last 5 of the same 14 candles. Their highest high is 1.10420 and their lowest low is 1.10260, a range of 16 pips. The close of 1.10400 is 14 pips above that low.
On a 5-candle setting, %K = 14 ÷ 16 × 100 = 87.5, while the same close reads 80 on a 14-candle setting. The price is identical, and only the setting changed.
Most platforms also smooth the stochastic. The common slow version averages %K over 3 candles and adds a second line, %D, which is an average of that smoothed line. Smoothing cuts noise and adds delay.
How traders read oscillators, and how good the evidence is
A handful of readings come up again and again, and each has a known weakness:
- A move back out of a zone, such as RSI falling from above 70 to below it, read as a fading push. In a trend the line often returns to the zone soon after.
- A cross of the middle line, 50 or zero, read as a change in momentum. By the time it happens, much of the move may be over.
- A divergence, where price makes a higher high and the oscillator a lower high. It can repeat over several swings before price turns, or never lead to a turn.
- An extreme reading at a support or resistance level in a range, used as a second opinion. The range can break at any time.
The evidence for simple overbought and oversold rules is weak. Tests of fixed oscillator rules on currencies tend to give results that change with the pair, the settings and the years studied, and trading costs can erase a small edge.
If you want to use an oscillator rule, write it down exactly and backtest it on your own pair and timeframe, costs included. The examples in this lesson illustrate the mechanics and are not recommendations.
Questions fréquentes
What is an oscillator in trading?
An indicator that moves within a fixed range, such as 0 to 100, or around a centre line such as zero. It compares the latest price with recent prices over a set number of candles.
Is RSI an oscillator?
Yes. The RSI is a bounded oscillator from 0 to 100 that compares the size of recent gains with recent losses, usually over 14 periods with reference lines at 70 and 30.
Does overbought mean the price will fall?
No. Overbought only means recent closes have been strong for the chosen period. In a trend the reading can stay overbought while the price keeps rising.
Which oscillator is the best?
None is best in every market. The common ones measure similar things in different ways, so learning one well and testing its settings tells you more than stacking several.
Are oscillators leading or lagging indicators?
They are calculated from past prices, so they react to price. They are often called leading because the line can turn before price does, though many of those turns come to nothing.
Continuer à apprendre
 Chapitre 1Leading and lagging indicators.A leading indicator tries to signal a turn before it happens, usually by measuring when a move is slowing, as RSI and the stochastic do. A lagging indicator, such as a moving average, confirms a move after it starts. Leading tools give more false alarms; lagging tools miss the start of each move.
 Chapitre 1Using oscillators when the market trends.In a strong trend, an oscillator such as RSI can stay overbought or oversold for a long time, so a reading above 70 is a weak reason to sell on its own. In a trend you flip the reading: wait for the oscillator to dip during a pullback and turn back with the trend, and still use a stop loss.
 Chapitre 1Momentum indicators and how to read them.A momentum indicator measures how fast price is changing by comparing the latest close with the close a set number of bars ago. When the line is above zero, price is higher than it was. A falling line means the move is slowing. It warns of a weakening trend but does not tell you when, or whether, price will reverse.
 Chapitre 1Oscillators and momentum cheat sheet.RSI and the stochastic run from 0 to 100 and are read at fixed levels such as 70 and 30. MACD, momentum and CCI have no fixed range and are read around a centre line. All are built from past prices, so an overbought reading can last through a strong trend and is not a sell signal by itself.
Courtiers partenaires

