What are Heikin Ashi candles?
Heikin Ashi candles are built from averaged prices. Each close is the average of the period's open, high, low and close, and each open is the midpoint of the previous Heikin Ashi body. The chart comes out smoother, so trends are easier to see, but its candles do not show where price actually opened and closed.
Konten ini baru tersedia dalam bahasa Inggris.
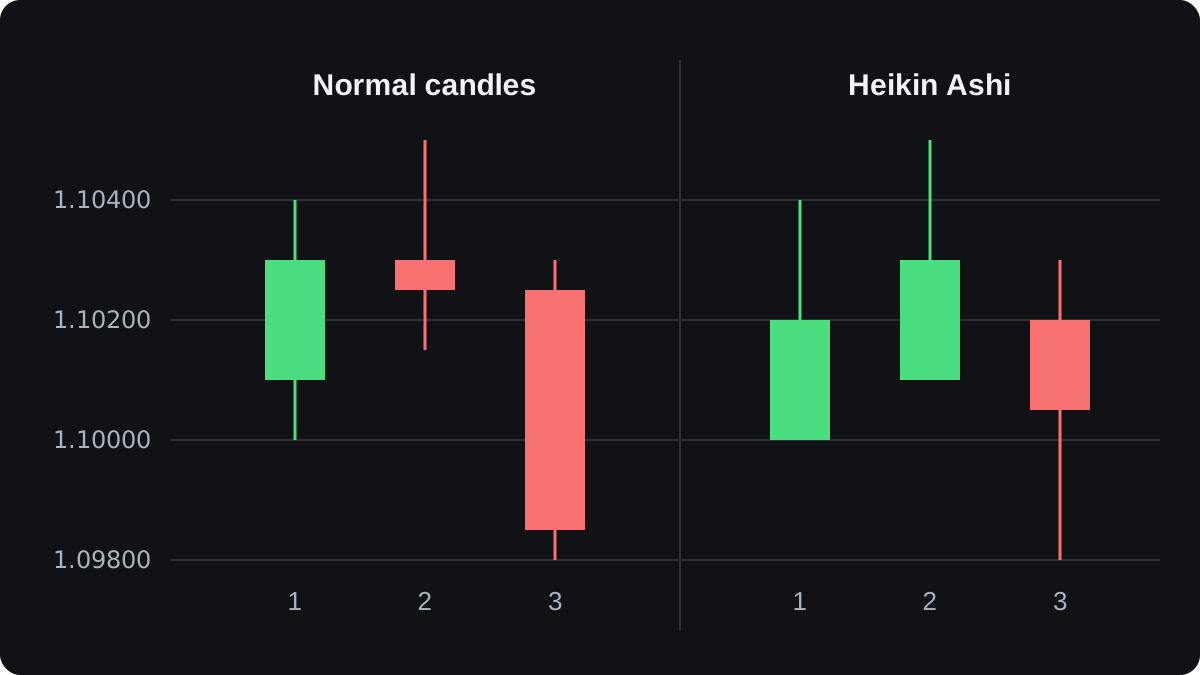
A normal candlestick records exactly what price did in one period. A Heikin Ashi candle takes the same prices and averages them with the candle before, so the chart comes out smoother and a trend is easier to follow.
The smoothing has a price. The open and close on a Heikin Ashi chart are calculated values, not the prices where the period actually started and ended, and some opens and wicks sit at prices that did not trade in that period.
It is one more way to draw price, alongside the line, bar and candlestick chart types. Heikin means average in Japanese, and ashi here means bar, so the name translates roughly as average bar. Some platforms spell it Heiken Ashi.
How is a Heikin Ashi candle built?
Every normal candle gives you four prices: open, high, low and close. The candlestick lesson explains each one.
A Heikin Ashi (HA) candle turns those four prices into four new values with these rules:
- HA close = (open + high + low + close) ÷ 4, the average of the current real candle.
- HA open = (previous HA open + previous HA close) ÷ 2, the midpoint of the previous Heikin Ashi body.
- HA high = the highest of the real high, the HA open and the HA close.
- HA low = the lowest of the real low, the HA open and the HA close.
A Heikin Ashi candle is an up candle when its close is above its open, and a down candle when its close is below. Your platform colours them the same way it colours normal candles.
The first candle on a chart has no Heikin Ashi candle before it. A common convention sets its open at the midpoint of the first real candle's open and close.
That starting value matters less with every candle. Each new open gives the previous open a weight of one half, so ten candles later the starting value's weight in the open is 1/1,024.
Working through three EUR/USD candles
The prices below are round illustrative numbers for three hourly EUR/USD candles. A pip on this pair is 0.0001. To start the chain, assume the previous Heikin Ashi candle opened at 1.09900 and closed at 1.10100.
The real candles looked like this:
| Candle | Open | High | Low | Close |
|---|---|---|---|---|
| 1 | 1.10100 | 1.10400 | 1.10000 | 1.10300 |
| 2 | 1.10300 | 1.10500 | 1.10150 | 1.10250 |
| 3 | 1.10250 | 1.10300 | 1.09800 | 1.09850 |
Applying the four rules to that data gives these Heikin Ashi candles:
| Candle | HA open | HA high | HA low | HA close |
|---|---|---|---|---|
| 1 | 1.10000 | 1.10400 | 1.10000 | 1.10200 |
| 2 | 1.10100 | 1.10500 | 1.10100 | 1.10300 |
| 3 | 1.10200 | 1.10300 | 1.09800 | 1.10050 |
Drawn side by side, the two charts disagree about candle 2. The real candle closed 5 pips lower, at 1.10250. The Heikin Ashi candle closed above its open and has no lower wick.
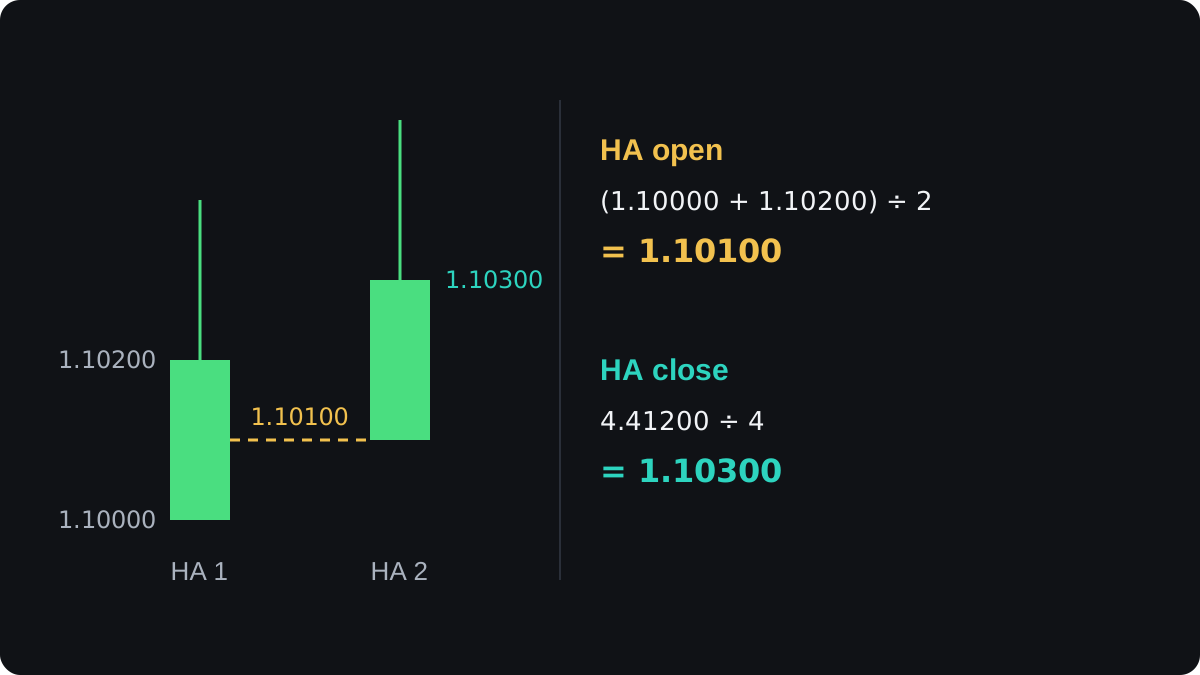
Candle 2 shows the method step by step:
- Add the real prices: 1.10300 + 1.10500 + 1.10150 + 1.10250 = 4.41200.
- HA close = 4.41200 ÷ 4 = 1.10300.
- HA open = (1.10000 + 1.10200) ÷ 2 = 1.10100, the midpoint of candle 1's Heikin Ashi body.
- HA high = the highest of 1.10500, 1.10100 and 1.10300, which is 1.10500.
- HA low = the lowest of 1.10150, 1.10100 and 1.10300, which is 1.10100.
The HA low equals the HA open, so the candle has no lower wick. The midpoint in step 3 is what ties each candle to the one before it.
You can check the other two candles the same way. For candle 3, (1.10250 + 1.10300 + 1.09800 + 1.09850) ÷ 4 = 4.40200 ÷ 4 = 1.10050, and the open is (1.10100 + 1.10300) ÷ 2 = 1.10200.
How do Heikin Ashi candles differ from normal candlesticks?
Every row in this table has a match in the three candles above.
| Feature | Normal candlestick | Heikin Ashi candle |
|---|---|---|
| Open | First traded price of the period | Midpoint of the previous HA body |
| Close | Last traded price of the period | Average of the four real prices |
| High and low | Real extremes | Can sit outside the real range |
| Gaps between bodies | Possible | None, each open sits inside the previous body |
| A small counter-move | Shows at once | Often hidden in a run of one colour |
Candle 2 shows the third row. Its HA low is 1.10100, but the real low that hour was 1.10150, so the chart displays a price 5 pips below anything traded in that hour.
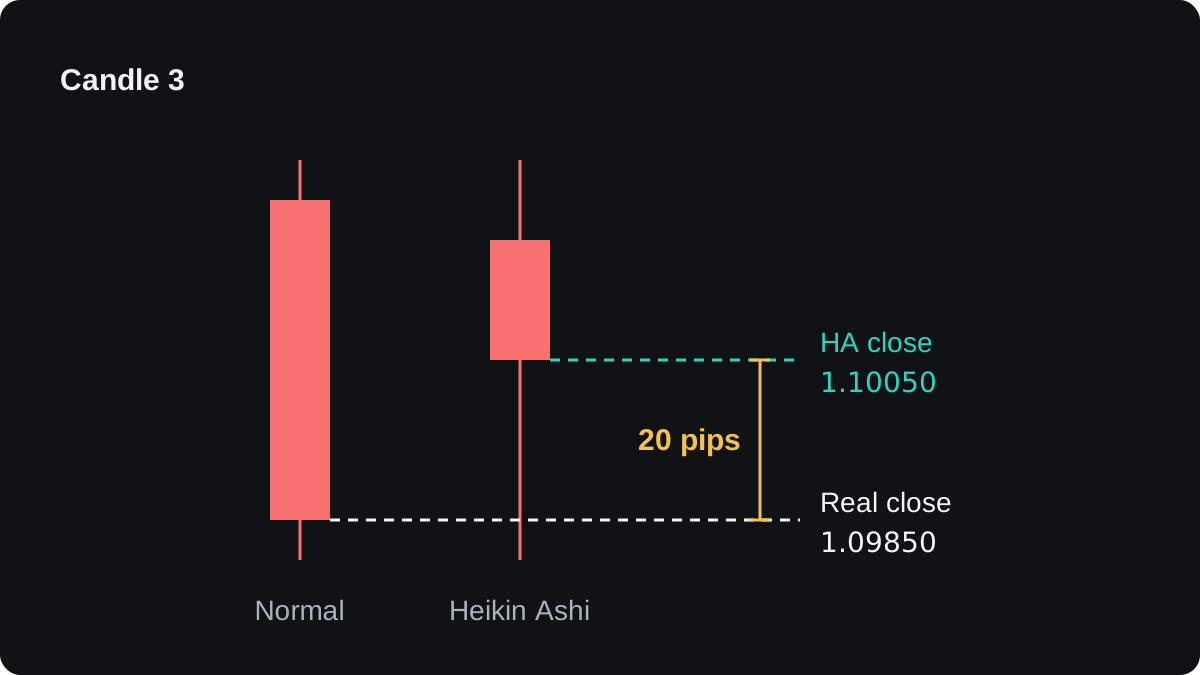
Candle 3 shows the lag. The real price fell 40 pips, from 1.10250 to 1.09850. The Heikin Ashi close is 1.10050, still 20 pips above where the hour actually ended.
The current Heikin Ashi candle also keeps changing while its real candle is open, because its close averages prices that are still moving. Its open is fixed from the start, since it depends only on the previous candle.
What do traders read from Heikin Ashi shapes?
Small pullbacks often fail to flip the colour, as candle 2 did, so a trend tends to show as a long run of same-coloured candles. That cleaner picture of direction is the main reason people use the chart.
The usual reading is that an up candle with no lower wick, like candle 2, shows steady buying, and a down candle with no upper wick shows steady selling.
A small body with wicks on both sides is read as a pause or a possible turn.
These readings describe what the averages are doing. They are not reliable signals on their own, and a run can end without any warning shape. Reading trends with Heikin Ashi covers them in detail.
The idea is close to a moving average: you get a smoother picture and pay for it with slower reactions.
Where Heikin Ashi falls short
Heikin Ashi adds no new information. It rearranges the same four prices, so it cannot see a move before a normal chart does, and it usually shows a turn later.
Your orders fill at real prices. Your broker fills market orders, a stop loss and take profit orders at the real bid and ask, whatever the Heikin Ashi chart shows.
In candle 2, the HA low of 1.10100 is 5 pips below the real low. A stop measured from that HA low is measured from a price the market never reached that hour.
Backtests need the same care. A test that enters at Heikin Ashi closes uses prices that were not on offer when each candle ended, and its results can look better than live trading would.
Run any backtest on real prices, even when the signals come from Heikin Ashi.
Classic candle patterns such as engulfing candles and doji were defined on real candles. Similar shapes on a Heikin Ashi chart come from averaged data, so the same name does not carry the same meaning.
There is no strong body of independent evidence that Heikin Ashi gives a trading edge by itself.
One way to handle its blind spots is to keep a normal chart beside it, using Heikin Ashi for direction and real candles for prices. The limitations lesson goes further into these problems.
Pertanyaan
Is Heikin Ashi better than normal candlesticks?
Neither is better in general. Heikin Ashi makes trends easier to see, while normal candles show the real prices you trade at, so it can help to look at both.
Can I use Heikin Ashi prices for entries and stops?
Not directly. Orders fill at the real bid and ask, and Heikin Ashi opens, closes and wicks are calculated values, some of which did not trade in that period.
Why is my Heikin Ashi candle green when the price fell?
Its close is an average and its open is the midpoint of the previous body, so a small drop can still leave the HA close above the HA open.
Candle 2 in this lesson fell 5 pips on the real chart and still printed as an up candle.
Does Heikin Ashi repaint?
A closed Heikin Ashi candle does not change. The current one updates until its real candle closes, and the first few candles on a chart depend on the starting value the platform used.
What does Heikin Ashi mean?
It is Japanese for roughly average bar. Heikin means average, and ashi here means bar.
Lanjut belajar
 Bab 1Reading trends with Heikin Ashi.On a Heikin Ashi chart, a strong uptrend shows as a run of green candles with no lower wick, and a strong downtrend as red candles with no upper wick. Shrinking bodies with wicks on both sides warn that the move may be slowing. Colour changes come late, because each candle's open is built from the candle before.
 Bab 1Heikin Ashi limitations.Heikin Ashi candles are built from averages, so their open and close are calculated values that need not match any price traded at that moment, and a wick can reach a price that never traded in that period. They are slow to show reversals. Take entries, stops and backtest fills from a normal candlestick chart.

