Combining Fibonacci with trend lines.
A Fibonacci retracement offers several levels where a pullback might stop. A trend line through earlier swing lows, or swing highs in a downtrend, narrows the choice: watch the level the line crosses around the time price returns to it. That meeting point is a zone of interest, and price can still break through it.
ខ្លឹមសារនេះមានតែជាភាសាអង់គ្លេសសិន។
Draw a Fibonacci retracement on a rising swing and you get four or five horizontal lines between the high and the low. Price can turn at any of them, or at none, so the tool by itself leaves you guessing.
A trend line gives you a second reference, drawn in a different way. Where it crosses one of the Fibonacci levels, you have one zone to watch in place of four.
Why one swing gives you several levels
Take an illustrative swing on EUR/USD from 1.08000 up to 1.10000. That is a move of 0.02000, or 200 pips.
A Fibonacci retracement measures how much of that move a pullback gives back. The usual levels are 23.6%, 38.2%, 50% and 61.8%, each measured down from the high.
On a 200 pip swing, 23.6% is 47.2 pips below the high, at 1.09528. The 38.2% level is 76.4 pips down, at 1.09236.
Half the move puts the 50% level at 1.09000. The 61.8% level is 123.6 pips down, at 1.08764.
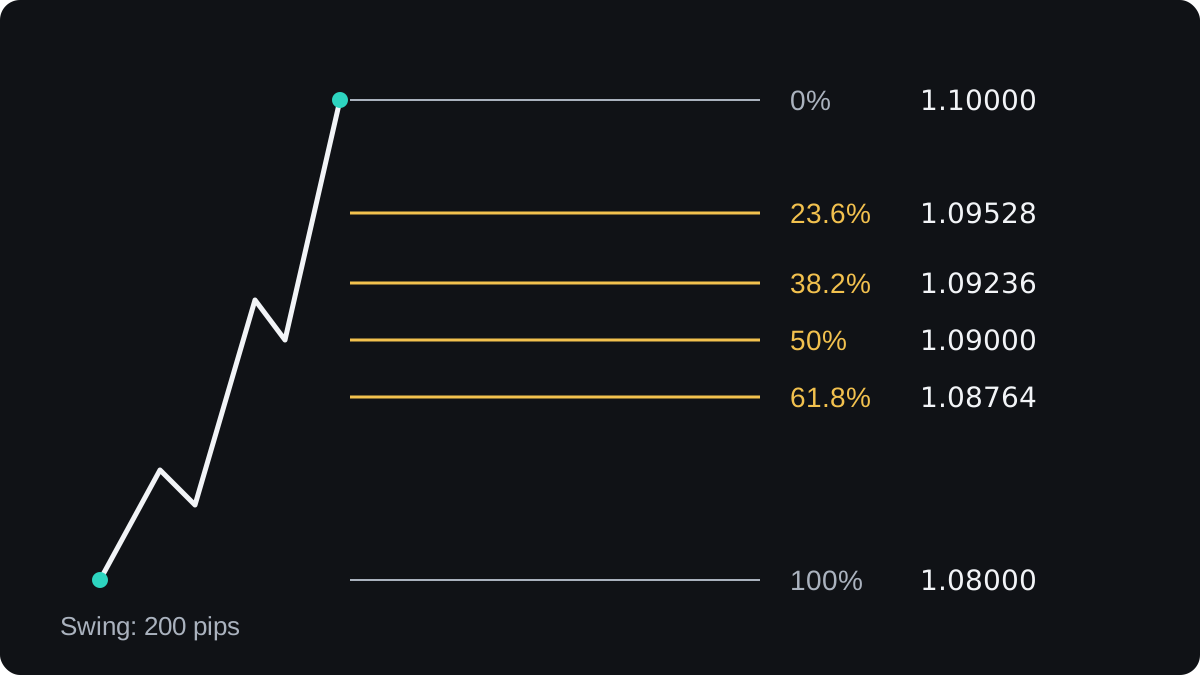
The 50% level is not a Fibonacci ratio. Charting tools include it by custom, and it is watched alongside the others.
Here the levels sit 23.6 to 29.2 pips apart. A pullback could pause at any of them, so a rule that picks one before price arrives saves you from deciding in the moment.
How a trend line narrows the choice
In an uptrend, a trend line joins two or more rising swing lows. It slopes upwards, so its price changes from one candle to the next, while each Fibonacci level stays flat.
- Draw the retracement from the swing low to the swing high, as in how to draw Fibonacci retracements.
- Draw a trend line through earlier swing lows, using the method from how to draw a trend line.
- Extend the line to the right, past the swing high.
- When price pulls back towards the line, read the line's price on that day and find the nearest level. That is your zone to watch.
A price where two separate tools agree is called confluence. The support and resistance lesson used a flat level for this, and a trend line does the same job on a slope.
Working the EUR/USD example step by step
Keep the same swing and add the day each point formed. The prices are illustrative, on a daily chart.
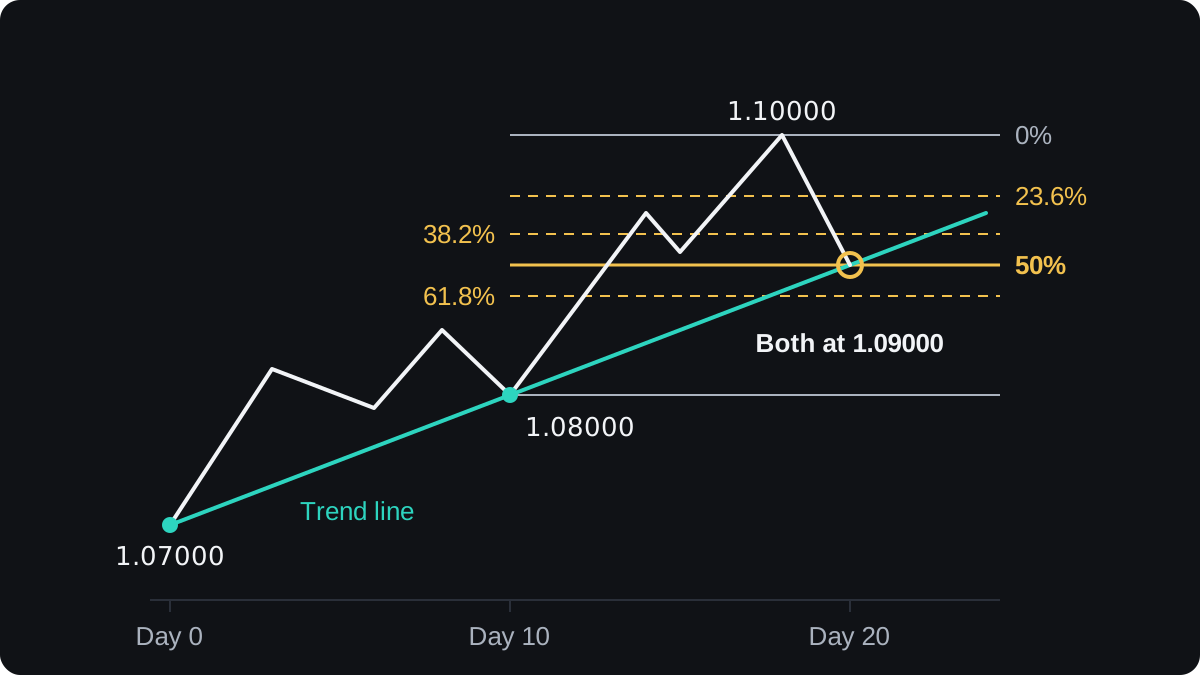
- The trend line touches 1.07000 on day 0 and 1.08000 on day 10. The day 10 low is also the start of the Fibonacci swing.
- The line rises 0.01000 in 10 days. That is 100 pips, or 10 pips per day.
- The swing high of 1.10000 forms on day 18. That day the line is at 1.07000 + 18 × 0.00100 = 1.08800.
- On day 20 the line is at 1.07000 + 20 × 0.00100 = 1.09000.
- That equals the 50% level. If price falls back to the line on day 20, both tools point at 1.09000.
Now check the 61.8% level at 1.08764. On day 18 the line is already 3.6 pips above it, and it climbs 10 pips a day from there.
After the high, then, price can only reach 61.8% by breaking below the trend line first. A break like that puts the uptrend in doubt, so the line no longer backs any level beneath it.
Why the meeting point moves with time
A flat level and a rising line cross at a single moment. If the pullback is slow, price meets the line later, and the line has climbed by then.
| Day | Trend line | Nearest Fibonacci level |
|---|---|---|
| 18 (the high) | 1.08800 | 61.8% at 1.08764, 3.6 pips below |
| 20 | 1.09000 | 50% at 1.09000, the same price |
| 22 | 1.09200 | 38.2% at 1.09236, 3.6 pips above |
| 24 | 1.09400 | 23.6% at 1.09528, 12.8 pips above |
The line crosses the 38.2% level at about day 22.4, since (1.09236 − 1.07000) ÷ 0.00100 = 22.36 days.
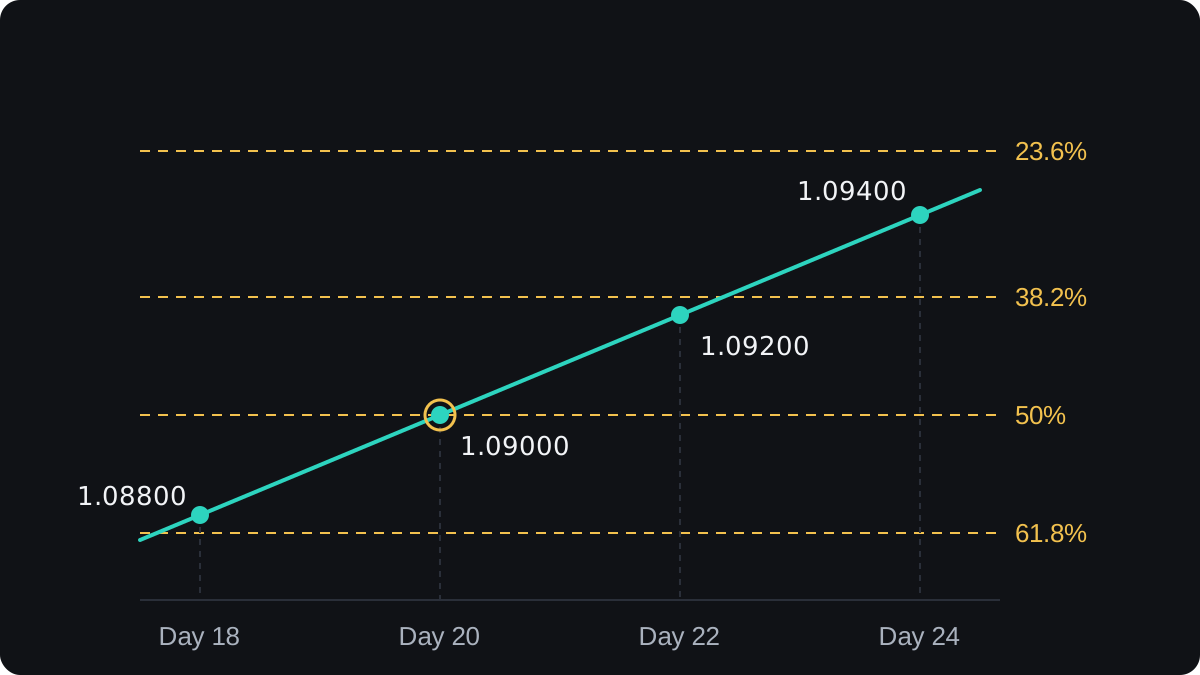
So the level that matters depends on speed. A sharp drop that reaches the line by day 20 points to 50%. A slow drift that takes until day 22 points to 38.2%.
Decide in advance how close counts as a meeting, for example within 5 pips. That tolerance is your own choice, and you should test it before you trust it.
The same check in a downtrend
In a downtrend you flip both tools. The retracement runs from the swing high to the swing low, the levels are measured up from the low, and the trend line joins falling swing highs above price.
Say USD/JPY falls from 152.00 to 148.00, an illustrative drop of 4.00. A yen pair's pip is 0.01, so that is 400 pips.
The 38.2% level is 148.00 + 1.528 = 149.528. The 50% level is 150.000, and 61.8% is 148.00 + 2.472 = 150.472.
Suppose a falling trend line drops 20 pips a day and sits at 150.500 on the day price rallies back to it. That is 2.8 pips above 61.8%, so 61.8% is the level to watch.
If the rally takes two more days, the line has fallen 40 pips to 150.100. It now sits 10 pips above the 50% level, a looser match. The Fibonacci calculator gives the levels for any swing you enter.
Where this combination fails
Two tools agreeing can look like strong evidence. Both, though, are drawn on the same price history by the same person, so the overlap is less independent than it seems.
Trend lines are subjective. Drawing through wicks instead of candle bodies, or choosing different touches, can move the line many pips and change which level it meets.
Fibonacci swings are subjective too. A different swing high or low shifts every level at once.
Price often breaks trend lines and passes through Fibonacci levels. Treat a meeting point as a place to look for more evidence, such as the candle signals in combining Fibonacci with candlestick patterns.
Published evidence that Fibonacci ratios predict turning points is weak. Some of their effect may come from traders watching the same lines. Test any rule on past charts and a demo account first, and decide where your stop loss goes if the zone fails.
សំណួរ
Which Fibonacci level matters most with a trend line?
None is best in general. The level that matters is the one the trend line crosses around the time price returns to the line, and that changes with the speed of the pullback.
Should I draw the trend line on wicks or closes?
Either is a fair choice if you stay consistent. Wicks use the extreme prices, closes ignore brief spikes, and the two choices can produce lines several pips apart.
What if price breaks the trend line before reaching a Fibonacci level?
Then the line no longer supports the uptrend view, and any level below it has lost its confluence. You can treat that as a reason to stand aside or wait for a new swing to draw.
Does confluence mean the price will reverse?
No. It marks a zone where two drawings agree, and price can still pass straight through it, so look for other evidence and size the trade for the case where it fails.
Can I use this on any timeframe?
Yes, the arithmetic is the same on a 15 minute chart and a weekly one. Short charts have more small swings, so you will find more lines and more meetings, which makes each one less special.
បន្តរៀន
 ជំពូក 3What are Fibonacci retracement levels?Fibonacci retracement levels are lines drawn at fixed percentages of a price move to mark how deep a pullback has gone. The usual levels are 23.6%, 38.2%, 50%, 61.8% and 78.6%. The middle three get the most attention, but the evidence that price turns at them more than anywhere else is weak.
 ជំពូក 3How to draw Fibonacci retracements.In an uptrend, draw a Fibonacci retracement from the swing low to the swing high, so the levels sit below the high. In a downtrend, draw from the swing high to the swing low, so the levels sit above the low. Use the clear extremes of one completed move, wick to wick.
 ជំពូក 3Combining Fibonacci with support and resistance.Combining Fibonacci with support and resistance means checking whether a retracement level sits on a price the market has reacted to before, such as an old high. When the two line up within a few pips, traders call it a confluence zone and watch it more closely. Price can still break straight through a zone.
 ជំពូក 3Combining Fibonacci with candlestick patterns.Combining Fibonacci with candlesticks means waiting for a reversal candle, such as a hammer or an engulfing pattern, to close at a retracement level before you enter. The level shows where a pullback might stop, and the candle shows buyers or sellers stepping in. The cost is a later entry, and the signal still fails often.
 ជំពូក 3Fibonacci extensions for profit targets.A Fibonacci extension projects how far a trend might run after a pullback. You measure the first swing, multiply it by ratios such as 61.8%, 100% and 161.8%, and add each result to the low of the pullback. Traders use the levels as possible take-profit targets, with no guarantee that price reaches them.
 ជំពូក 3Placing stops with Fibonacci levels.A Fibonacci stop goes beyond the next retracement level past your entry, plus a small buffer for the spread and noise. Buy at 50% and the stop sits under 61.8%; sell at 50% and it sits above 61.8%. Then cut the lot size so the wider stop still risks only the money you planned.
 ជំពូក 3Fibonacci cheat sheet.Fibonacci retracement levels are 23.6%, 38.2%, 50%, 61.8% and 78.6% of the last swing, drawn from swing low to swing high in an uptrend. Extensions such as 127.2% and 161.8% project targets. A single level is weak evidence, so look for confluence, and stops usually sit beyond the level or the swing.

