Heikin Ashi limitations.
Heikin Ashi candles are built from averages, so their open and close are calculated values that need not match any price traded at that moment, and a wick can reach a price that never traded in that period. They are slow to show reversals. Take entries, stops and backtest fills from a normal candlestick chart.
ខ្លឹមសារនេះមានតែជាភាសាអង់គ្លេសសិន។
A Heikin Ashi chart can print a candle with almost no body while the market you trade has just fallen 80 pips.
The chart is doing what it was built to do: each candle is an average, and an average moves later and less sharply than price.
The previous lesson used that smoothing to read trends. This one covers what the smoothing costs you when you place real orders.
Why is a Heikin Ashi close not a price you can trade?
A normal candle records four real prices. A Heikin Ashi candle replaces them with blends, built as shown in what Heikin Ashi candles are:
- HA close = (real open + real high + real low + real close) ÷ 4
- HA open = (previous HA open + previous HA close) ÷ 2
- HA high = the highest of the real high, the HA open and the HA close
- HA low = the lowest of the real low, the HA open and the HA close
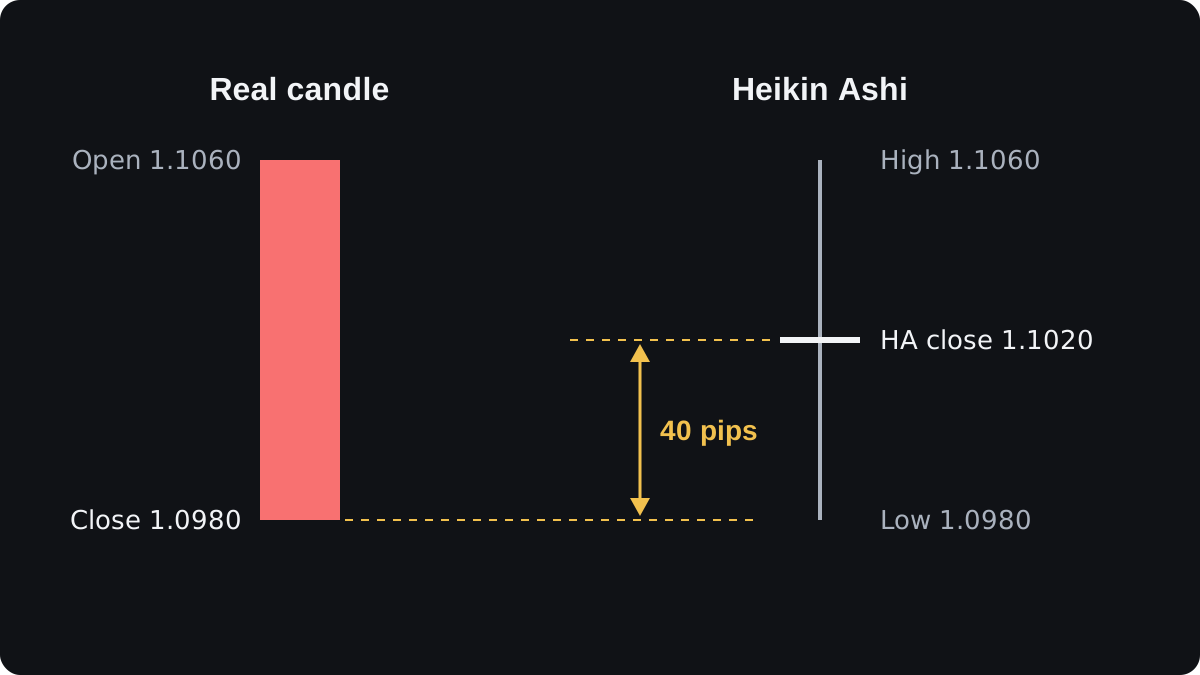
Take one EUR/USD candle with round illustrative prices, and call it candle 1. It opens at 1.1060, falls without a bounce and closes at its low of 1.0980. That is an 80-pip drop.
The HA close is (1.1060 + 1.1060 + 1.0980 + 1.0980) ÷ 4 = 1.1020. The previous HA candle ran from 1.1000 to 1.1040, so the new HA open is (1.1000 + 1.1040) ÷ 2 = 1.1020.
Open and close are equal, so the Heikin Ashi chart draws a doji, a candle with almost no body. The real market closed 40 pips lower, at 1.0980, and a sell order at that moment would have filled near 1.0980.
How late does Heikin Ashi show a reversal?
The averaging that softened candle 1 also delays the signal. Here are three candles in a row, all illustrative, first as real prices:
| Candle | Open | High | Low | Close |
|---|---|---|---|---|
| 0 | 1.1020 | 1.1065 | 1.1015 | 1.1060 |
| 1 | 1.1060 | 1.1060 | 1.0980 | 1.0980 |
| 2 | 1.0980 | 1.1000 | 1.0940 | 1.0960 |
And as the Heikin Ashi values worked out from them:
| Candle | HA open | HA high | HA low | HA close |
|---|---|---|---|---|
| 0 | 1.1000 | 1.1065 | 1.1000 | 1.1040 |
| 1 | 1.1020 | 1.1060 | 1.0980 | 1.1020 |
| 2 | 1.1020 | 1.1020 | 1.0940 | 1.0970 |
Check candle 2 yourself. The HA close is (1.0980 + 1.1000 + 1.0940 + 1.0960) ÷ 4 = 1.0970, and the HA open is (1.1020 + 1.1020) ÷ 2 = 1.1020.
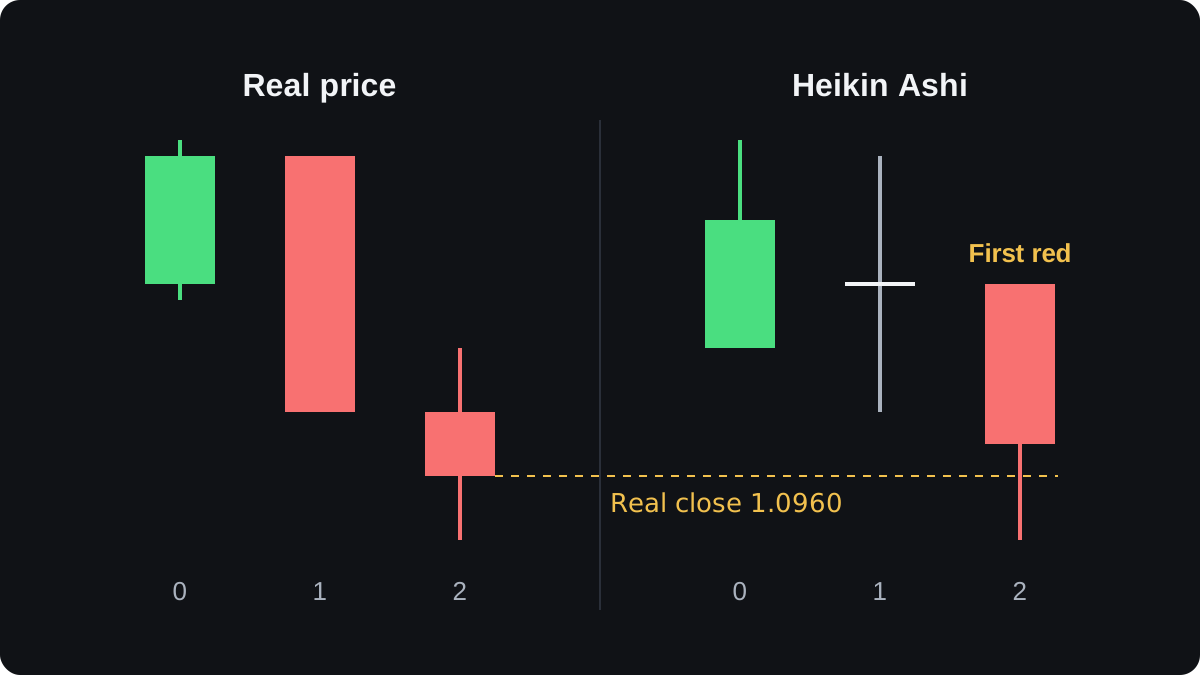
The close is below the open, so this is the first red Heikin Ashi candle.
Say your rule is to sell when the first red Heikin Ashi candle closes. By then the real price is 1.0960, which is 100 pips below the real close of candle 0 at 1.1060.
Sideways markets cause a different problem. When price swings back and forth, the colour can still flip every few candles, and each flip comes late, so a ranging market can turn a colour rule into a run of small losses.
Where should a stop go when the high never traded?
Candle 2 has a Heikin Ashi high of 1.1020, because its HA open sits there. The real high was 1.1000. During that candle, no trade happened anywhere between 1.1000 and 1.1020.
The formula allows this on any candle. A Heikin Ashi high is never below the real high, and a Heikin Ashi low is never above the real low, so wicks can stretch to prices the market did not reach in that period.
Suppose you sell 0.10 lot of EUR/USD at the real close of 1.0960, ignoring the spread. A pip on 0.10 lot is 10,000 × 0.0001 = $1. Each stop below sits exactly on a high, with no buffer, to keep the sums simple.
- Stop at the HA high: 1.1020 minus 1.0960 = 0.0060, which is 60 pips, or $60 at risk.
- Stop at the real high: 1.1000 minus 1.0960 = 0.0040, which is 40 pips, or $40 at risk.
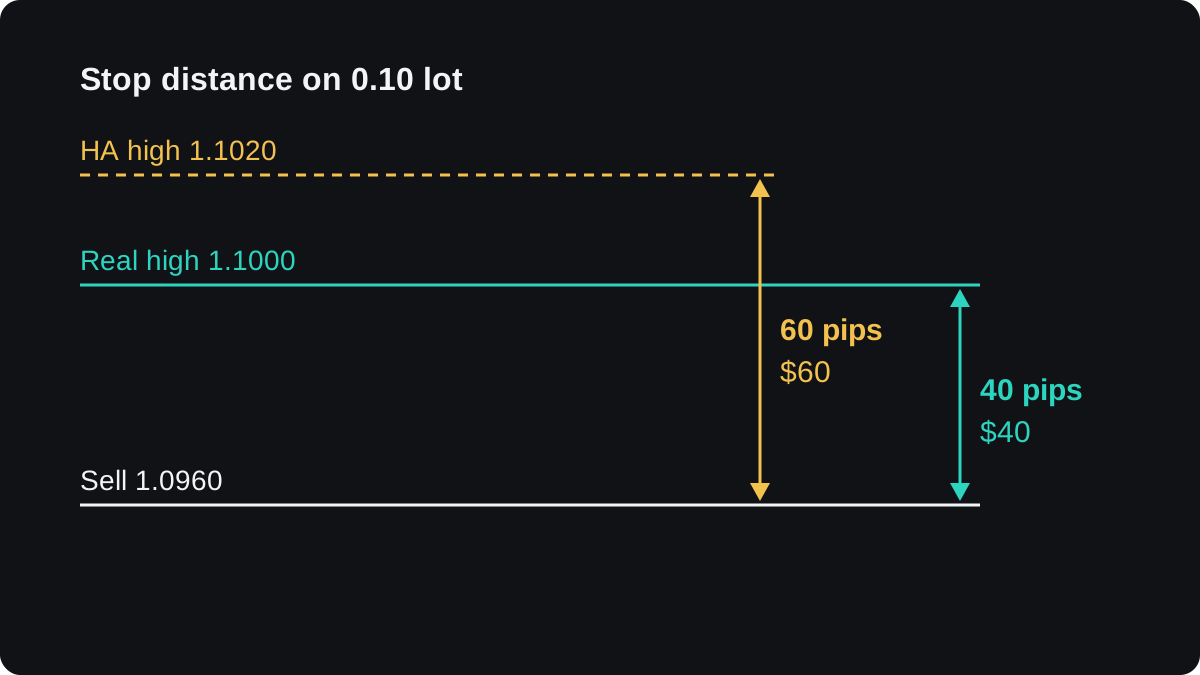
Neither level is correct by default. What matters is knowing which one you used, because on the same position the Heikin Ashi stop risks 50% more money.
If you size each trade to a fixed amount of risk, a wider stop means a smaller position. The position size lesson shows that sum, and the common stop loss methods use swing highs and lows that price actually printed.
Why can backtests on Heikin Ashi prices look too good?
Some charting tools can run a strategy test directly on a Heikin Ashi chart. If that test fills each order at the HA close, it trades at prices that may not have been on offer at that moment.
In the example, such a test would record the sell at 1.0970, the HA close of candle 2. The market offered 1.0960 at that close. On 0.10 lot, those 10 pips are $10 of profit that never existed.
The HA close trails the real price. After a fall it usually sits above the real close, and after a rise it usually sits below, so a trend-following test that fills there gets a slightly better price on many trades.
Before you trust any backtest built on Heikin Ashi, check which prices it fills at. Then rerun it with fills at real prices and the spread included, and compare the two results.
What else does the averaging hide?
Weekend gaps
The HA open is the midpoint of the previous HA body, so it ignores the real open.
When forex reopens after the weekend at a different price, the Heikin Ashi chart shows no gap between candles, and the jump is folded into the new candle's averages.
Candle patterns
Patterns such as the doji or the engulfing pattern are defined on real opens and closes, as in how to read a candlestick. On Heikin Ashi the same shapes come from averages, so the usual reading of a pattern does not carry over.
The live candle
Until a candle closes, its HA close is recalculated on every price change, and its colour can flip more than once. A closed candle no longer changes, so rules judged on closed candles avoid acting on a colour that later reverses.
The first candles on the chart
The very first HA open has no previous candle, so a platform has to seed it with an estimate. Its weight halves with each new candle, so after about ten candles two charts of the same data match almost exactly.
How can you use Heikin Ashi without being misled?
Keep two charts of the same pair and timeframe. The Heikin Ashi one shows direction, and the normal candlestick one supplies every number you act on.
- Read the trend from Heikin Ashi colour and wicks.
- Take your entry, recent swing highs and lows, and stop levels from the real chart.
- Size the trade from the real stop distance in pips.
- Test any rule with fills at real prices, spread included, on a demo before using money.
Smoother candles do not create an edge by themselves. A rule built on them has to prove itself on the prices your broker actually fills, and the lag shown in this lesson is part of every such test.
សំណួរ
Why does my Heikin Ashi price not match my broker's price?
The HA close is the average of the real candle's open, high, low and close. Your broker quotes a bid and an ask, and those are the prices your orders fill at.
Can I backtest a strategy on Heikin Ashi candles?
You can use Heikin Ashi to produce the signals, but fill the trades at real prices with the spread included. A test that fills at HA closes can show profit the market never offered.
Does Heikin Ashi repaint?
A closed candle does not change once the next one starts. The live candle changes with every price move, so its colour can flip before it closes.
Should I place my stop at the Heikin Ashi high or low?
Heikin Ashi highs and lows can be prices that never traded in that period. Your stop is triggered by real prices, so check the real swing high or low before you place it, and know which level you used.
បន្តរៀន
 ជំពូក 1What are Heikin Ashi candles?Heikin Ashi candles are built from averaged prices. Each close is the average of the period's open, high, low and close, and each open is the midpoint of the previous Heikin Ashi body. The chart comes out smoother, so trends are easier to see, but its candles do not show where price actually opened and closed.
 ជំពូក 1Reading trends with Heikin Ashi.On a Heikin Ashi chart, a strong uptrend shows as a run of green candles with no lower wick, and a strong downtrend as red candles with no upper wick. Shrinking bodies with wicks on both sides warn that the move may be slowing. Colour changes come late, because each candle's open is built from the candle before.

