Standard, Fibonacci and Camarilla pivots.
All three methods use the previous day's high, low and close. Standard pivots set P = (H + L + C) ÷ 3 and build levels from P and the range. Fibonacci pivots place levels 38.2%, 61.8% and 100% of the range either side of P. Camarilla pivots cluster tightly around the close using the constant 1.1.
ខ្លឹមសារនេះមានតែជាភាសាអង់គ្លេសសិន។

Pivot points all start from the same three prices: the previous day's high, low and close. The methods differ only in the arithmetic that turns those prices into levels above and below the market.
This lesson runs the three common formulas on one set of illustrative EUR/USD prices, so you can see where each set of levels lands. The introduction to pivot points covered what the levels are for.
What goes into every pivot formula?
Take a previous day on EUR/USD with a high (H) of 1.10700, a low (L) of 1.09700 and a close (C) of 1.10500. The prices are round on purpose so the sums stay easy to follow.
The range is the high minus the low: 1.10700 − 1.09700 = 0.01000, which is 100 pips. The pivot point, P, is the plain average of the three prices:
P = (H + L + C) ÷ 3 = (1.10700 + 1.09700 + 1.10500) ÷ 3 = 3.30900 ÷ 3 = 1.10300
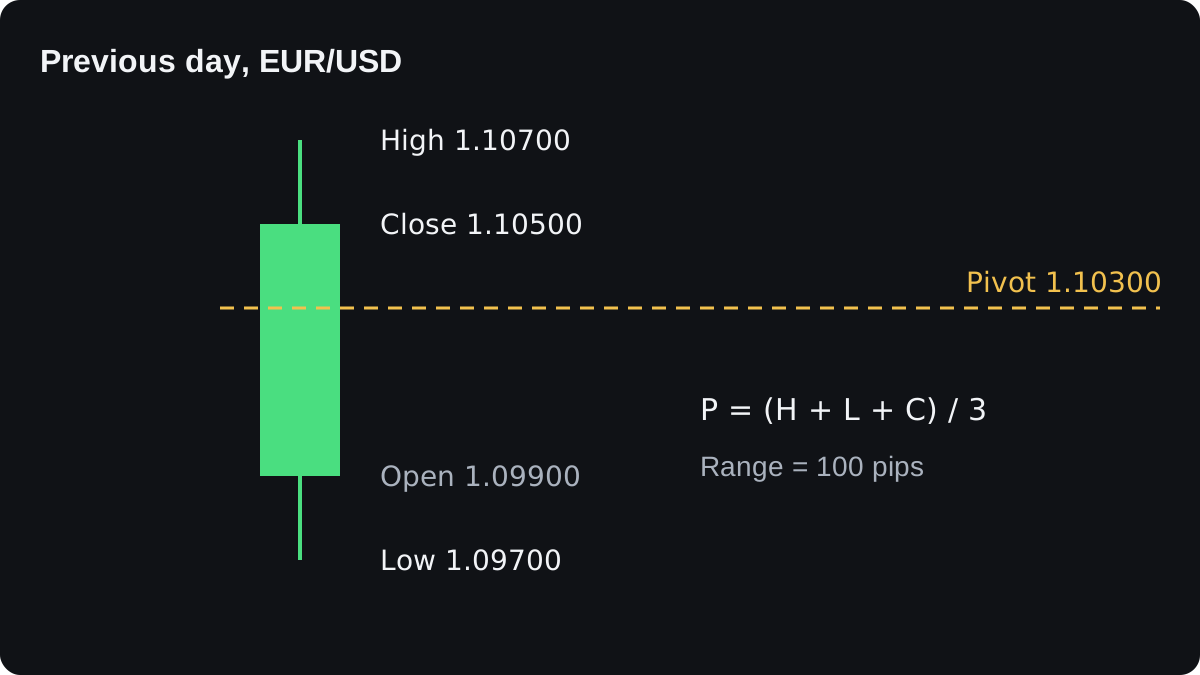
The day opened at 1.09900, but the open plays no part in any of the three formulas. Standard and Fibonacci pivots build outward from P, while Camarilla pivots build outward from the close.
Which day counts as the previous day depends on your broker's server clock. Some brokers end the daily candle at 17:00 New York time and others at midnight GMT, so one formula can give two sets of levels.
A broker whose day ends at midnight GMT may also show a short Sunday candle. If your pivot tool treats it as a full day, Monday's levels come from a few quiet hours of trading.
How are standard pivots calculated?
Standard pivots, also called floor pivots, add three resistance levels above P (R1 to R3) and three support levels below it (S1 to S3). These are the formulas:
- R1 = 2 × P − L
- S1 = 2 × P − H
- R2 = P + range
- S2 = P − range
- R3 = H + 2 × (P − L)
- S3 = L − 2 × (H − P)
With the example prices:
- 2 × P = 2 × 1.10300 = 2.20600.
- R1 = 2.20600 − 1.09700 = 1.10900.
- S1 = 2.20600 − 1.10700 = 1.09900.
- R2 = 1.10300 + 0.01000 = 1.11300, and S2 = 1.10300 − 0.01000 = 1.09300.
- P − L = 0.00600, so R3 = 1.10700 + 2 × 0.00600 = 1.11900.
- H − P = 0.00400, so S3 = 1.09700 − 2 × 0.00400 = 1.08900.
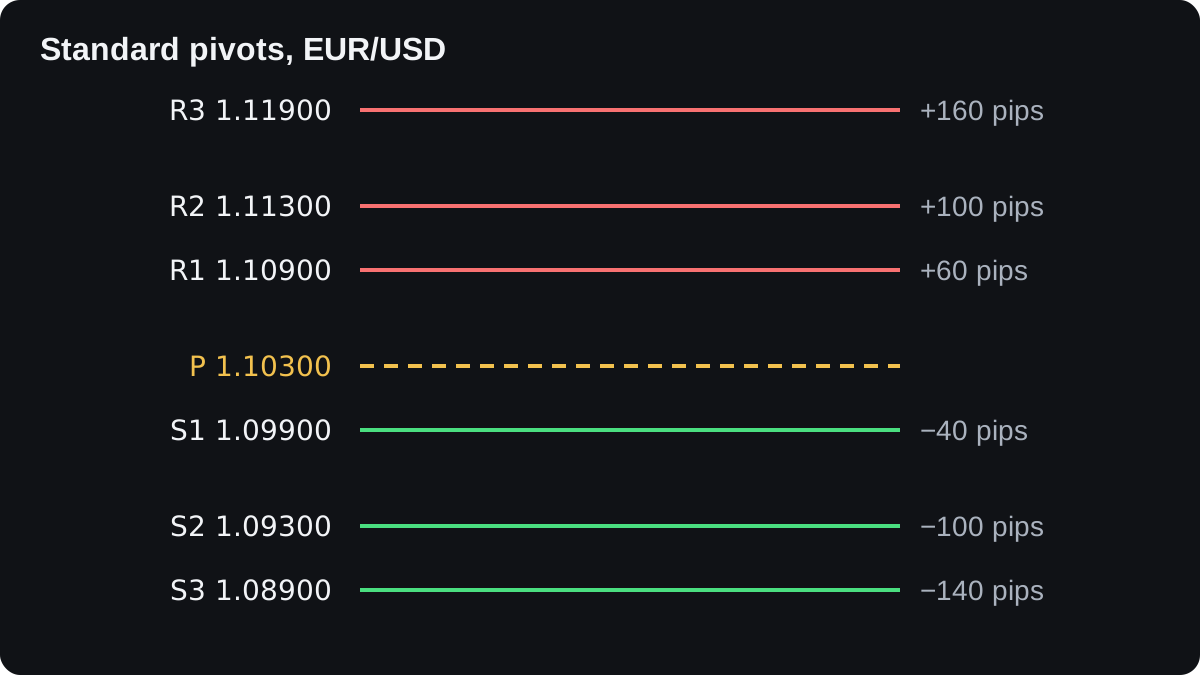
R1 sits 60 pips above P, while S1 is only 40 pips below it. The close near the high pulled P upward, so the first two levels are lopsided. R2 and S2 are always exactly one range from P.
You can check your work with two shortcuts. R3 always equals R1 plus the range, and S3 equals S1 minus the range: 1.10900 + 0.01000 = 1.11900 and 1.09900 − 0.01000 = 1.08900.
How do Fibonacci pivots differ?
Fibonacci pivots keep the same P and place every other level at a fixed fraction of the range. The fractions are 0.382, 0.618 and 1.000, ratios also used in Fibonacci retracements.
- R1 and S1 = P ± 0.382 × range
- R2 and S2 = P ± 0.618 × range
- R3 and S3 = P ± 1.000 × range
With a range of 0.01000, the three steps are 0.00382, 0.00618 and 0.01000, which is 38.2, 61.8 and 100 pips.
- R1 = 1.10300 + 0.00382 = 1.10682, and S1 = 1.10300 − 0.00382 = 1.09918.
- R2 = 1.10300 + 0.00618 = 1.10918, and S2 = 1.10300 − 0.00618 = 1.09682.
- R3 = 1.10300 + 0.01000 = 1.11300, and S3 = 1.10300 − 0.01000 = 1.09300.
The levels are mirror images around P. The close affects them only through P, so the lopsided R1 and S1 of the standard method disappear. Fibonacci R3 and S3 land exactly on the standard R2 and S2.
The ratios come from a number sequence, and there is no proven reason that prices should respect them. Treat them as one more convention for spacing lines.
Versions differ slightly between platforms, so compare one level with your own sum.
How do Camarilla pivots differ?
Camarilla pivots skip P. They start from the close and add or subtract slices of the range, each built from the constant 1.1:
- R1 and S1 = C ± range × 1.1 ÷ 12
- R2 and S2 = C ± range × 1.1 ÷ 6
- R3 and S3 = C ± range × 1.1 ÷ 4
- R4 and S4 = C ± range × 1.1 ÷ 2
For a range of 0.01000, the slices are 0.00092, 0.00183, 0.00275 and 0.00550, rounded to five decimals. That is about 9.2, 18.3, 27.5 and 55 pips.
- R1 = 1.10500 + 0.00092 = 1.10592, and S1 = 1.10500 − 0.00092 = 1.10408.
- R2 = 1.10500 + 0.00183 = 1.10683, and S2 = 1.10500 − 0.00183 = 1.10317.
- R3 = 1.10500 + 0.00275 = 1.10775, and S3 = 1.10500 − 0.00275 = 1.10225.
- R4 = 1.10500 + 0.00550 = 1.11050, and S4 = 1.10500 − 0.00550 = 1.09950.
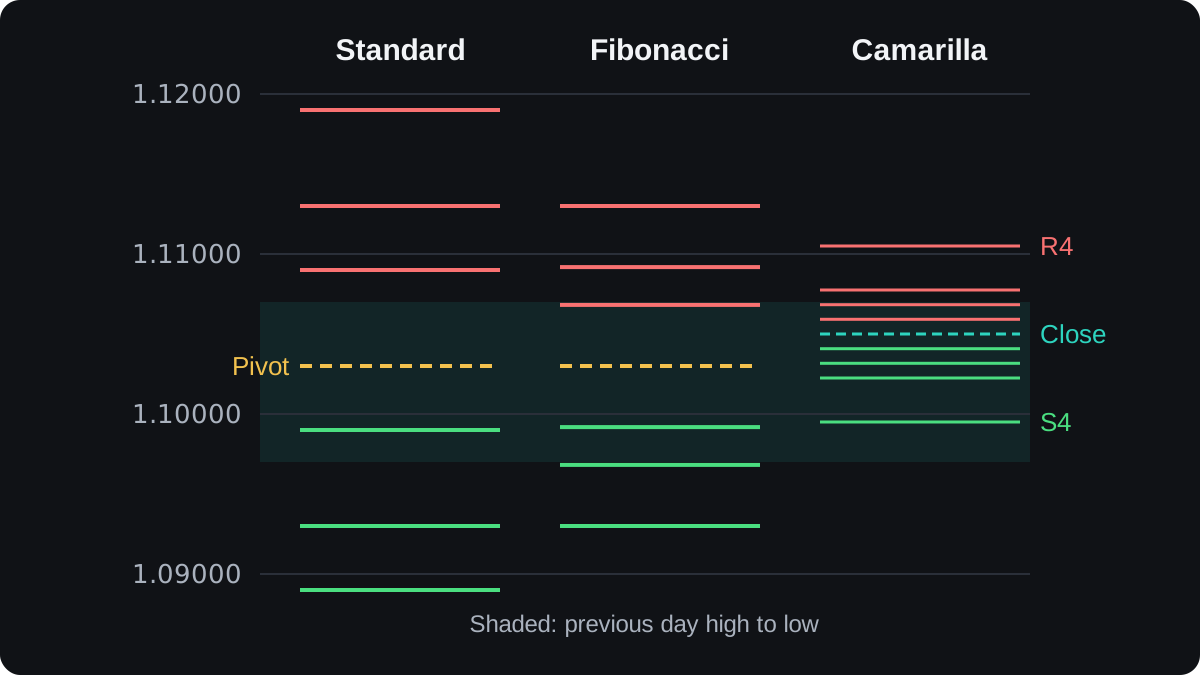
The whole set fits inside 110 pips, from 1.09950 to 1.11050. The standard set in the same example spans 300 pips, from 1.08900 to 1.11900.
The usual Camarilla reading treats R3 and S3 as places where price may turn, and R4 and S4 as places where a breakout may start. That reading is a habit among users, and nothing guarantees that price will behave that way.
The 1.1 constant has no economic meaning; it is simply part of the recipe. Some versions also add R5, S5 or a central pivot.
How do the three sets compare?
Side by side, the same three inputs give three quite different maps of the day ahead:
| Level | Standard | Fibonacci | Camarilla |
|---|---|---|---|
| R4 | none | none | 1.11050 |
| R3 | 1.11900 | 1.11300 | 1.10775 |
| R2 | 1.11300 | 1.10918 | 1.10683 |
| R1 | 1.10900 | 1.10682 | 1.10592 |
| Centre | P 1.10300 | P 1.10300 | C 1.10500 |
| S1 | 1.09900 | 1.09918 | 1.10408 |
| S2 | 1.09300 | 1.09682 | 1.10317 |
| S3 | 1.08900 | 1.09300 | 1.10225 |
| S4 | none | none | 1.09950 |
The outer standard and Fibonacci levels sit well beyond the previous day's high of 1.10700 and low of 1.09700. Six of the eight Camarilla levels sit inside that range, close to where the day ended, so price has less distance to travel to touch them.
The arithmetic works the same on any pair once you use the right pip size. Say USD/JPY had a high of 151.00, a low of 149.50 and a close of 150.70.
P = (151.00 + 149.50 + 150.70) ÷ 3 = 451.20 ÷ 3 = 150.40. The range is 1.50, or 150 pips, because a yen pip is 0.01.
With 2 × P = 300.80, standard R1 is 300.80 − 149.50 = 151.30 and S1 is 300.80 − 151.00 = 149.80.
The pivot point calculator runs these formulas for any high, low and close you enter.
Which formula should you use?
None of the three is correct in a mathematical sense. Each is a rule for drawing lines, and a line matters only if price reacts near it.
There is no strong, widely accepted evidence that one formula predicts turning points better than another. The usual argument for standard pivots is that they are the common default, so more people may be watching those exact prices.
Whichever set you use, read each level as a zone of a few pips. Price often turns short of a line or pushes a little past it before reversing.
When you first load a pivot indicator, check one level against your own sum. Keep the same daily candle source too, since a different server clock changes every level.
How traders build entries, stops and targets around these levels, and where that goes wrong, is the subject of trading with pivot points.
សំណួរ
Which pivot point formula is the most common?
Standard pivots, with P = (H + L + C) ÷ 3 and levels R1 to R3 and S1 to S3, are the usual default in charting tools. Fibonacci and Camarilla are normally options you switch on.
Can you use pivot points on weekly or monthly charts?
Yes. Weekly pivots use the previous week's high, low and close, and monthly pivots use the previous month's, with the same formulas.
What are Woodie pivots?
Woodie pivots give the close double weight: P = (H + L + 2 × C) ÷ 4. With this lesson's prices that is (1.10700 + 1.09700 + 2.21000) ÷ 4 = 4.41400 ÷ 4 = 1.10350.
Why do my pivot levels differ from another platform's?
The usual cause is a different daily candle, because the two server clocks end the day at different times. Versions of the Fibonacci and Camarilla formulas also vary slightly, so compare the high, low and close each platform uses.
បន្តរៀន
 ជំពូក 3What are pivot points?Pivot points are support and resistance levels calculated from the previous period's high, low and close. The main pivot, P, is the average of those three prices. Formulas built from P and the previous high and low then give resistance levels R1 to R3 above it and support levels S1 to S3 below it, fixed for the whole period.
 ជំពូក 3How to trade with pivot points.Pivot points give two common trade setups. In a range, traders buy near S1 or sell near R1 and target the central pivot. On a breakout, they trade a candle close through R1 or S1 toward R2 or S2. In both, the stop sits just beyond the level, so a failed level costs a small, planned loss.
 ជំពូក 3Pivot points cheat sheet.A pivot point is the average of the previous period's high, low and close: P = (H + L + C) ÷ 3. Standard levels come from P and the range, Fibonacci pivots sit 38.2%, 61.8% and 100% of the range from P, and Camarilla levels sit near the previous close. None predicts where price will turn.

