Why support and resistance are zones, not lines.
Price rarely turns at one exact number, because orders spread out around a level and price feeds differ slightly between brokers. Treat support and resistance as a zone: a band from the bodies to the wicks of past reactions. Put your stop beyond the far edge, then size the trade so the risk stays fixed.

Mark the last four times EUR/USD turned lower near 1.1000 and write down each high. With illustrative prices, you might get 1.1004, 1.1010, 1.1001 and 1.1007. None of them is 1.1000, and no single line touches all four.
Price reacts to an area. Drawing that area as a band, with a top and a bottom, shows where sellers or buyers stepped in, and it changes where your stop loss belongs.
Why doesn't price turn at one exact price?
The lesson on drawing levels used single lines, which is a fine first sketch. Look closely at any reaction, though, and the turn is spread over several pips.
Several ordinary things cause that:
- Traders watching the same level place their orders a few pips apart, some in front of it and some beyond. Price turns once enough of them fill, wherever that happens.
- A round price like 1.1000 tends to gather orders on both sides, so the reaction smears a little above and below it.
- Each broker builds its own price feed, so a high of 1.1004 on one platform can print as 1.1003 or 1.1005 on another.
- MetaTrader draws candles from the bid price by default, while a buy order fills at the ask, which is higher by the spread.
- Some traders draw levels from wicks and others from closing prices, so two careful charts of the same reaction can show different numbers.
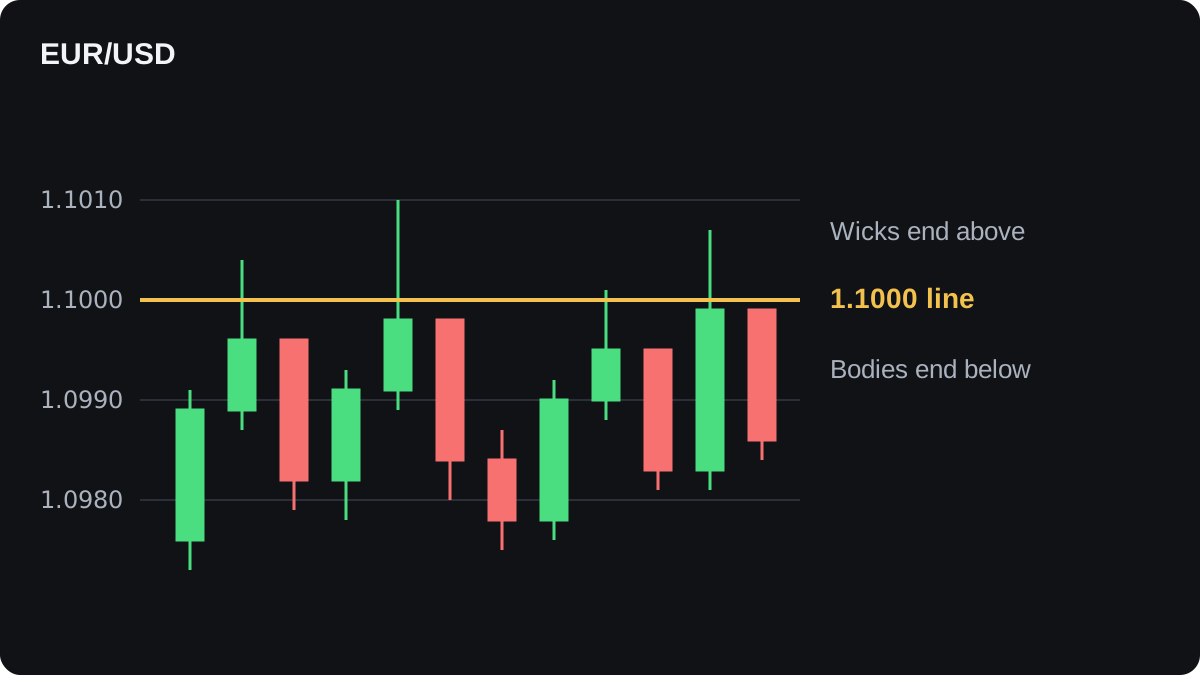
In the illustrative chart below, every reaction wick ends above 1.1000 and every candle body ends below it. A line at 1.1000 falls between the two and matches none of the turning points.
How do you mark a zone?
A zone is a band of price with a top edge and a bottom edge, drawn around a place where price has turned more than once. One simple method takes both edges from the reaction candles themselves.
For resistance, the top edge is the highest wick among the reactions. The bottom edge is the lowest body top, where the body top is the higher of the open and the close.
For support, turn the method upside down. The bottom edge is the lowest wick, and the top edge is the highest body bottom.
Here are the four reactions from the chart, with illustrative prices:
| Reaction | Wick high | Body top |
|---|---|---|
| 1 | 1.1004 | 1.0996 |
| 2 | 1.1010 | 1.0998 |
| 3 | 1.1001 | 1.0995 |
| 4 | 1.1007 | 1.0999 |
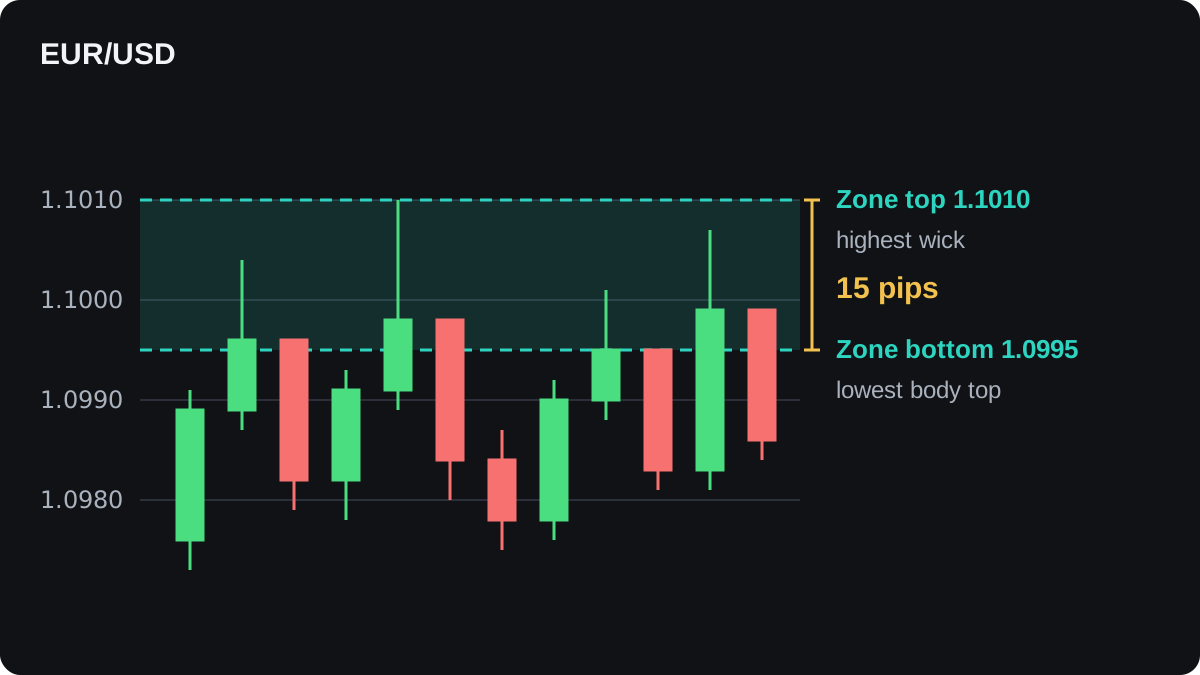
- Find the highest wick high: 1.1010. That is the top of the zone.
- Find the lowest body top: 1.0995. That is the bottom of the zone.
- Measure the width: 1.1010 minus 1.0995 = 0.0015. On EUR/USD a pip is 0.0001, so the zone is 15 pips wide.
All four reactions now sit inside one band, wicks and bodies alike.
A zone only helps if it is narrow enough to act on. Compare its width with how far a single candle usually travels on the same timeframe; the volatility lesson shows ways to measure that.
Zones on a daily chart usually come out wider than on a 15 minute chart, because each candle covers more ground. If one wick sticks far beyond the rest, such as a spike on a news release, you can leave it out and note why.
What changes when you read the level as a zone?
A test becomes easier to recognise. Price that reaches 1.0997 has tested resistance, even though it stopped 3 pips short of 1.1000.
A break needs more proof. A candle that pokes above 1.1010 and closes back inside the band has tested the zone and failed to break it.
Decide in advance what counts as a real break, such as a candle close above the top edge at 1.1010. Writing the rule down stops you from redrawing the zone after the fact.
Entries change too. A sell order resting exactly at 1.1000 can fill and then sit through a run to 1.1010. Waiting for price to enter the zone and turn lower first avoids that, at the cost of a less favourable price.
Where should your stop loss go?
Place it beyond the far edge of the zone, plus a small buffer for the spread and for ordinary noise. A stop inside the zone sits where price has already traded during earlier reactions.
Here is a worked example with illustrative prices and an illustrative account. Price enters the resistance zone, turns lower, and you sell EUR/USD at 1.0990.
Your account holds $5,000 and you risk 1% per trade, which is $50. Compare two stops, each placed 5 pips past its level:
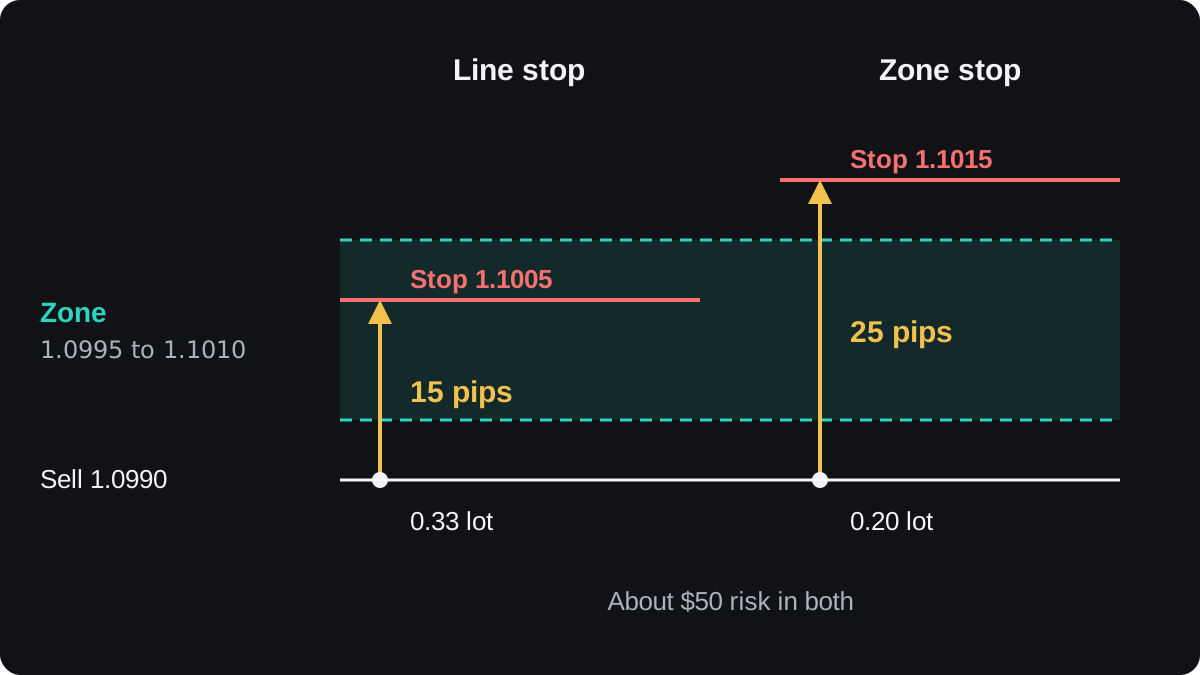
- Line stop: 5 pips above 1.1000 is 1.1005. The distance is 1.1005 minus 1.0990 = 0.0015, or 15 pips.
- Zone stop: 5 pips above 1.1010 is 1.1015. The distance is 1.1015 minus 1.0990 = 0.0025, or 25 pips.
- In a US dollar account, one standard lot of EUR/USD is worth $10 a pip. Over 25 pips that is 25 × $10 = $250 per lot.
- Size for $50 of risk: $50 ÷ $250 = 0.20 lot. Check: on 0.20 lot a pip is $2, and 25 × $2 = $50.
- For the line stop: 15 × $10 = $150 per lot, and $50 ÷ $150 = 0.333, rounded down to 0.33 lot. That risks 15 × $3.30 = $49.50.
| Stop | Price | Distance | Size | Risk |
|---|---|---|---|---|
| Line stop | 1.1005 | 15 pips | 0.33 lot | $49.50 |
| Zone stop | 1.1015 | 25 pips | 0.20 lot | $50.00 |
Both trades risk about $50, because the wider stop is paid for with a smaller position.
What differs is where each stop sits. Two of the four earlier wicks, 1.1010 and 1.1007, rose above 1.1005, so a repeat of either would close the line-stop trade while the zone still held.
The spread makes it worse. The stop on a sell trade is triggered by the ask, which sits above the bid prices drawn on the chart.
With an illustrative 1 pip spread, the 1.1004 wick meant an ask of 1.1005, which would also hit the line stop. The zone stop clears all four: the 1.1010 wick meant an ask of about 1.1011, still 4 pips short of 1.1015.
The position size lesson and the lot size calculator repeat this sum for other pairs and account sizes.
A stop beyond the zone is still no guarantee. Price can run through it, and in a fast market a stop can fill at a worse price than the one you set. The stop loss methods lesson compares other ways to set the distance.
When do zones let you down?
A zone can grow too wide to use. If it spans 80 pips on an hourly chart, a stop beyond it forces a tiny position or a large risk, and the trade is hard to justify.
Hindsight makes zones look better than they are. On an old chart you can fit a band around almost any group of highs. A fairer test is to mark the zone before price returns and record whether it held.
Stops tend to gather just past obvious edges. Because they sit close together, a quick spike through the zone can fill them and then reverse, the pattern covered in false breakouts.
Support and resistance are widely used, yet research on whether they predict turns in currency prices is limited, and the effects it reports tend to be small. A zone marks where to pay close attention, with no forecast attached.
When price does close well beyond a zone, the old band can matter again from the other side, with former resistance turning into support. The lesson on role reversal covers that next.
Questions
How wide should a support or resistance zone be?
Wide enough to hold the wicks and bodies of past reactions, and narrow enough that a stop beyond it still gives a sensible position size. Compare its width with the typical range of one candle on the same timeframe.
Should I use wicks or closing prices to draw a zone?
Use both. Wicks mark the extreme of each reaction and bodies show where price settled, so a zone that runs from one to the other covers the whole reaction.
Where do I put a stop loss with a zone?
Beyond the far edge of the zone, with a small buffer for the spread and noise. Then size the position so that stop distance risks only the amount you planned.
Is a wick through the zone a breakout?
A wick that closes back inside the zone is a test. Set your rule for a break in advance, such as a candle close beyond the edge.
Do support and resistance zones always hold?
No. Zones break, and price can spike through one and come back, so a zone tells you where to watch closely and makes no prediction on its own.
Keep learning
 Chapter 1What are support and resistance levels?Support is a price area where falling prices have stopped and turned up more than once, because buyers stepped in there. Resistance is the opposite: an area where rises have stalled because sellers took over. Traders use both to plan entries, stops and targets, but any level can break, so none is a guarantee.
 Chapter 1How to draw support and resistance.To draw support and resistance, find swing highs and lows where price turned at about the same price two or more times, then draw a horizontal line through that cluster. Start on the daily or weekly chart for the main levels, refine them on a 4-hour or 1-hour chart, and keep only the nearest few.
 Chapter 1When support becomes resistance.When price breaks through a support level, that level often acts as resistance when price returns to it, and broken resistance often turns into support. The return visit is called a retest. Traders watch for a candle that reaches into the old zone and closes back on the break side, though the flip can fail.
 Chapter 1How to draw a trend line.To draw an uptrend line, connect two or more rising swing lows and extend the line to the right. For a downtrend, connect falling swing highs. Two points draw the line, a third reaction is the usual sign it is confirmed, and a candle closing clearly beyond it usually means the line has stopped counting.
 Chapter 1Price channels and how to trade them.A price channel is two parallel lines that contain a trend: a trend line along the swing lows or highs and a copy on the other side. Near the lower edge a buy aims for the upper edge, and the reverse at the top. A close outside either line can mean the channel has ended.
 Chapter 1Trading the bounce or the break.Trading the bounce means buying near support or selling near resistance while the level holds, with a stop just beyond it. Trading the break means entering after price closes through the level, with a stop back inside the old range. Bounce trades fail when the level breaks; break trades fail on false breakouts.
 Chapter 1Support and resistance cheat sheet.Support is a price area where falls have stopped before, and resistance is one where rises have stopped. Mark them as zones from clear swing highs and lows, expect broken levels to swap roles, and plan every bounce or break with a stop beyond the zone. Levels show where to watch, and any of them can break.

