When support becomes resistance.
When price breaks through a support level, that level often acts as resistance when price returns to it, and broken resistance often turns into support. The return visit is called a retest. Traders watch for a candle that reaches into the old zone and closes back on the break side, though the flip can fail.

Picture EUR/USD bouncing twice from the same price area, near 1.0950. Then one day it falls straight through. A few days later it climbs back to that same area and turns lower again.
The floor has become a ceiling. This is called role reversal: a support level that breaks often acts as resistance afterwards, and a broken resistance level often acts as support.
What does role reversal look like on a chart?
The lesson on support and resistance zones drew levels as bands rather than thin lines. Keep that habit here. In this example, with illustrative prices, the zone runs from 1.0950 to 1.0960.
Price drops into the zone twice and bounces each time, so the zone is support. On the third visit it breaks down and falls to 1.0915.
Then price rallies back to 1.0955, inside the old zone, and turns down again toward 1.0880. That return visit to a broken level is called the retest.
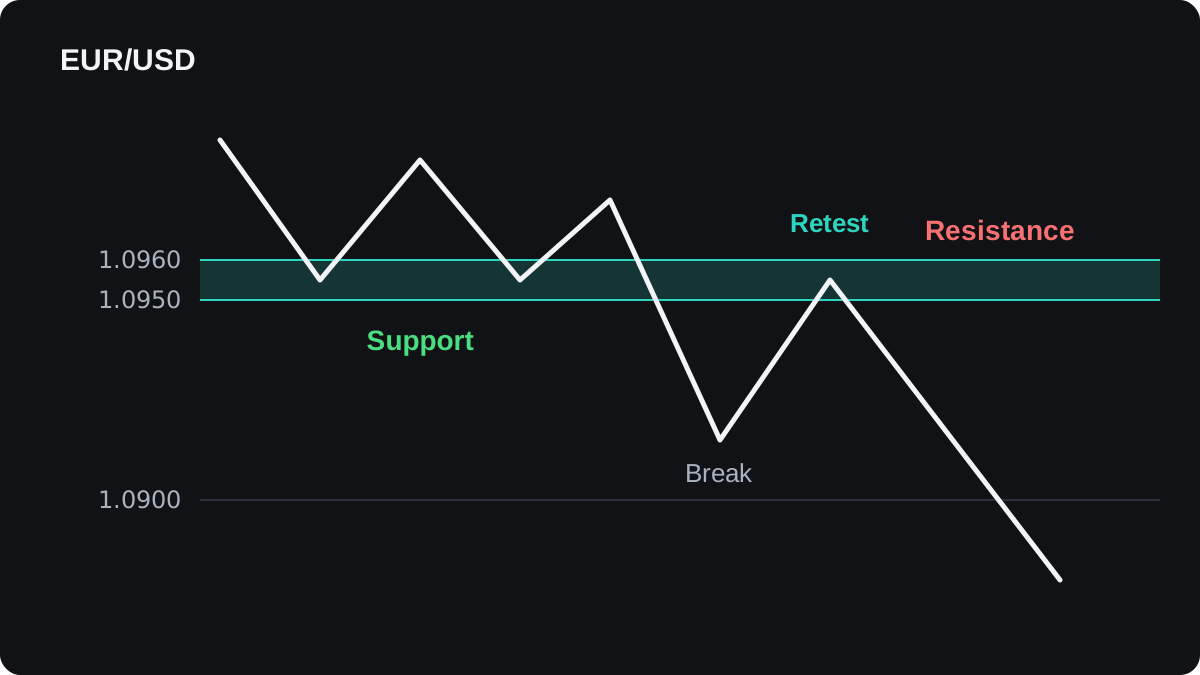
The mirror case works the same way upside down. A resistance zone that has capped price breaks to the upside, price pulls back to it, and the zone can then hold as support.
Neither version is guaranteed. A level is only an area where buying or selling showed up before, as the lesson on what support and resistance are explained.
Why can a broken level switch roles?
The usual explanation is about the orders traders left behind. Think about who acted at 1.0950 to 1.0960 while it was still support.
Some traders bought there, expecting another bounce. When the zone broke, their trades went into loss. If price comes back to their entry, some will close at breakeven to get out, and closing a long trade means selling.
Others sold the break and may add to their short positions on the rally. Another group missed the move and waits for price to return to the level before selling.
All of them place sell orders in the same area, so that area can hold the price down. Round numbers such as 1.0950 may also gather pending orders, because many people watch the same chart.
That account is plausible, but it is hard to prove. Where a level sits depends on who draws it, and charts seen in hindsight show the flips that worked more clearly than the ones that failed.
Treat role reversal as a tendency that you can test on your own charts, and give it no more weight than that.
How do you spot a retest as it happens?
A retest follows a sequence. Checking each step in order stops you from calling every wiggle a flip.
- The break is clear. A candle closes beyond the zone, rather than only poking through it with a wick.
- Price moves away. It travels a fair distance past the zone, so the break is more than noise around the level.
- Price returns. It climbs back into the old zone or close to it.
- The zone reacts. A candle reaches into the zone and closes back on the break side, often leaving a long wick.
Candle reading helps most at step 4. The lesson on candle signals at key levels covers rejection candles in more detail.
For a broken support zone, these signs tend to separate the two outcomes. None of them is certain on its own.
| What you see on the retest | Leans toward a flip | Leans toward a failed break |
|---|---|---|
| Candle close | Back below the zone | Above the zone top |
| Wicks | Long upper wicks into the zone | Little rejection, large bodies |
| Time at the zone | A brief touch | Many candles sitting inside it |
| Next move | A lower low after the retest | A high above the zone |
How would a trade on the retest add up?
The numbers continue the EUR/USD chart above and are illustrative. The trade shows the arithmetic only and is no recommendation to place it.
- During the retest, a candle reaches 1.0955 inside the zone and closes at 1.0945, back below it.
- You sell 0.10 lot at 1.0945. On EUR/USD a pip is 0.0001, so on 0.10 lot (10,000 euros) each pip is worth 10,000 × 0.0001 = $1.
- The stop loss goes above the zone top, at 1.0975. The distance is 1.0975 minus 1.0945 = 0.0030, which is 30 pips, or $30.
- The target is 1.0885, just above an older support area further down the chart. The distance is 1.0945 minus 1.0885 = 0.0060, which is 60 pips, or $60.
- The trade risks 30 pips to make 60, a risk-reward ratio of 1 to 2.
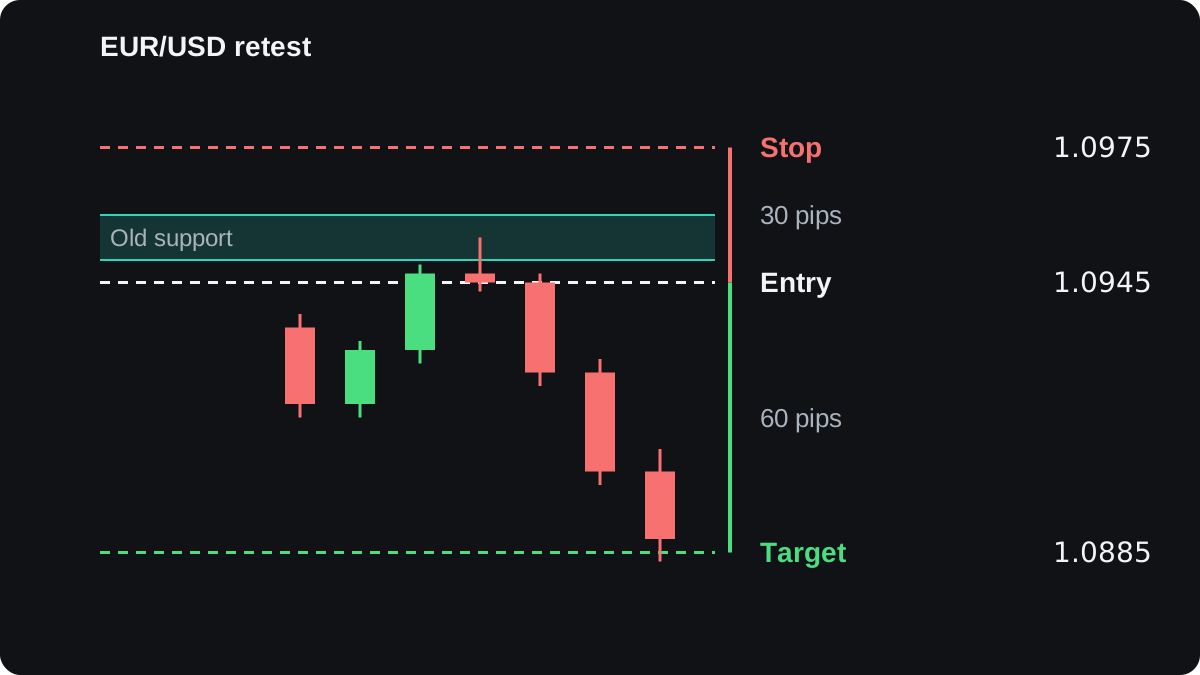
The stop sits 15 pips beyond the zone top at 1.0960. If price closes back above the zone, the idea that it is now resistance is wrong, and the stop takes you out.
These sums ignore the spread and any commission, which make each outcome slightly worse in practice.
You can also size the trade from the stop. Suppose you hold $5,000 and decide to risk 1%, which is $50. Dividing $50 by 30 pips gives about $1.67 per pip, or about 0.167 lot.
Round down to 0.16 lot, where a pip is worth $1.60, and the trade risks 30 × $1.60 = $48. The lesson on position size walks through this method for other pairs.
When does the flip fail?
Many breaks never give a clean retest. Price can drop through the zone and keep going, and then you either stay out or chase a worse price.
The break itself can be false. Price closes below the zone, then climbs back above it a few candles later.
The zone may now be support again, and anyone who sold the retest is caught on the wrong side. The lesson on false breakouts covers this case.
A retest can also slice straight through. If price rallies into the zone and closes above its top, the old support has failed as resistance and the setup is void.
Levels wear out too. A zone that price has crossed back and forth many times shows no clear side, so it tells you little about the next move.
The timeframe matters as well. A zone that stands out on a daily chart is likely watched by more people than one that only shows on a 5-minute chart, and a big news release can push price through any level whatever its history.
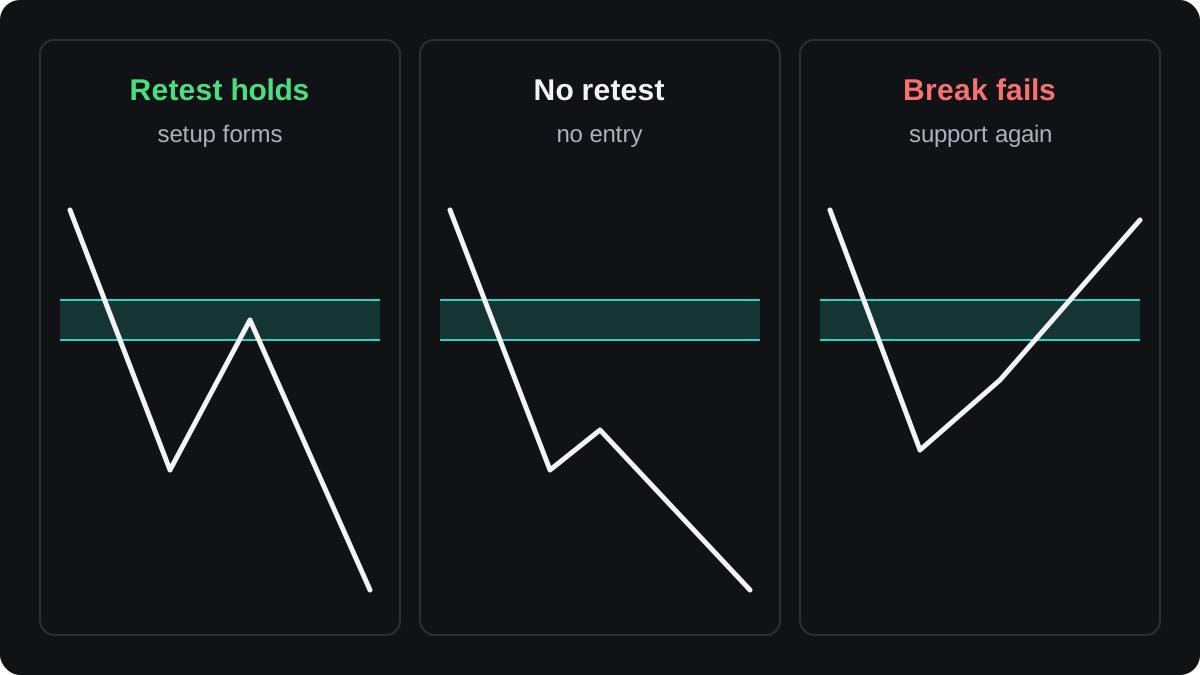
Whether to trade the first break or wait for a retest is a separate choice with trade-offs on both sides, and the bounce or break lesson compares them.
Questions
What is role reversal in support and resistance?
It is the tendency for a broken level to switch jobs. Broken support can act as resistance when price returns to it, and broken resistance can act as support.
Does price always retest a broken level?
No. Some breaks run away without returning, and some retests push right through the zone. A missed retest is a missed trade, and it loses you no money.
Is broken support stronger as resistance?
Do not assume it is. The flip is a tendency whose strength varies from chart to chart, so let the candles on the retest show whether the old level holds.
How far into the zone can a retest go?
A retest can reach any part of the zone and still hold. After a support break, a candle closing above the top of the zone is the usual sign that the flip has failed.
Can a level flip more than once?
Yes, and each flip makes it less clear. A zone crossed many times in both directions no longer shows which side controls it.
Keep learning
 Chapter 1What are support and resistance levels?Support is a price area where falling prices have stopped and turned up more than once, because buyers stepped in there. Resistance is the opposite: an area where rises have stalled because sellers took over. Traders use both to plan entries, stops and targets, but any level can break, so none is a guarantee.
 Chapter 1How to draw support and resistance.To draw support and resistance, find swing highs and lows where price turned at about the same price two or more times, then draw a horizontal line through that cluster. Start on the daily or weekly chart for the main levels, refine them on a 4-hour or 1-hour chart, and keep only the nearest few.
 Chapter 1Why support and resistance are zones, not lines.Price rarely turns at one exact number, because orders spread out around a level and price feeds differ slightly between brokers. Treat support and resistance as a zone: a band from the bodies to the wicks of past reactions. Put your stop beyond the far edge, then size the trade so the risk stays fixed.
 Chapter 1How to draw a trend line.To draw an uptrend line, connect two or more rising swing lows and extend the line to the right. For a downtrend, connect falling swing highs. Two points draw the line, a third reaction is the usual sign it is confirmed, and a candle closing clearly beyond it usually means the line has stopped counting.
 Chapter 1Price channels and how to trade them.A price channel is two parallel lines that contain a trend: a trend line along the swing lows or highs and a copy on the other side. Near the lower edge a buy aims for the upper edge, and the reverse at the top. A close outside either line can mean the channel has ended.
 Chapter 1Trading the bounce or the break.Trading the bounce means buying near support or selling near resistance while the level holds, with a stop just beyond it. Trading the break means entering after price closes through the level, with a stop back inside the old range. Bounce trades fail when the level breaks; break trades fail on false breakouts.
 Chapter 1Support and resistance cheat sheet.Support is a price area where falls have stopped before, and resistance is one where rises have stopped. Mark them as zones from clear swing highs and lows, expect broken levels to swap roles, and plan every bounce or break with a stop beyond the zone. Levels show where to watch, and any of them can break.

