Ascending, descending and symmetrical triangles.
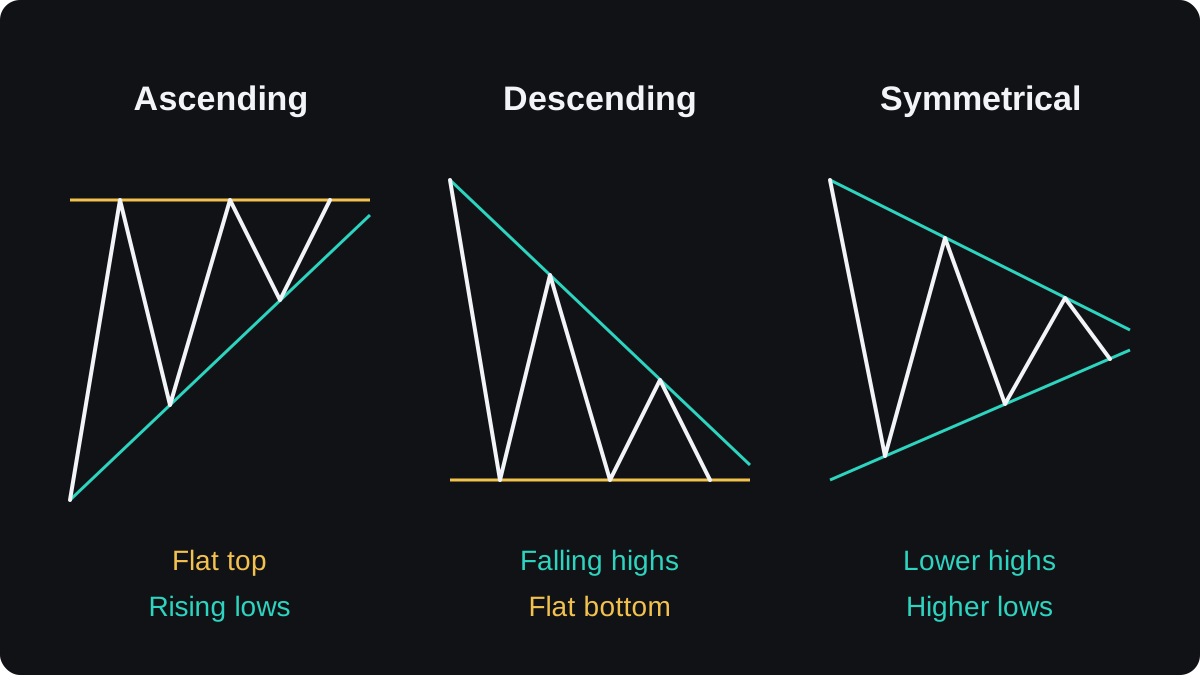
A triangle is a pattern where price swings narrow between two converging trend lines. An ascending triangle has a flat top and rising lows, a descending triangle a flat bottom and falling highs, and a symmetrical triangle slopes on both sides. Each can break either way, so a common rule is to wait for a close outside the lines.
ខ្លឹមសារនេះមានតែជាភាសាអង់គ្លេសសិន។

When price swings start to shrink, the chart can squeeze into a narrowing range. Rallies stall sooner, dips stop higher, or both at once. Draw one line across the highs and one across the lows, and the lines head toward a meeting point.
That shape is a triangle. Traders watch it because a squeeze often ends with a faster move out of the range, though the shape alone does not tell you which way that move will go.
What turns a narrowing range into a triangle?
A triangle needs two trend lines that converge. The upper line joins at least two swing highs, and the lower line joins at least two swing lows. The point where the lines would cross is called the apex.
The slope of each line gives the pattern its name. An ascending triangle has a flat upper line and a rising lower line. A descending triangle has a falling upper line and a flat lower line.
A symmetrical triangle has a falling upper line and a rising lower line, so both sides close in on each other.
The pattern ends with a breakout, a move that closes outside one of the lines. A common filter is to wait for a candle to close beyond the line, because brief pokes through it often reverse.
The ascending triangle: flat top, rising lows
In an ascending triangle, sellers keep turning price back at the same level. That flat top is resistance. Meanwhile buyers step in sooner on each dip, so the lows climb.
The usual reading is bullish. Buyers keep pressing on one price, and if the sellers there run out of orders, price can break upward.
That reading describes a tendency, with no guarantee behind it. Ascending triangles also break down through the rising line, and the fall can be quick once the higher lows stop holding.
The descending triangle: flat bottom, falling highs
A descending triangle is the mirror image. Buyers defend a flat floor of support, while each rally gives up at a lower high. The usual reading is bearish, and upward breaks happen here too.
The pattern looks the same on any pair, but watch the pip size. Say USD/JPY holds support at 150.00 and its first rally inside the triangle peaks at 151.20. These prices are illustrative.
The height is 151.20 − 150.00 = 1.20. On a yen pair a pip is 0.01, so that is 120 pips. A close below 150.00 would point to 150.00 − 1.20 = 148.80 as a first target.
The symmetrical triangle: both sides squeeze
Here the highs fall and the lows rise at similar rates. Neither buyers nor sellers hold a fixed level, so the shape has no built-in direction.
The traditional reading is that a symmetrical triangle tends to break in the direction of the trend that came before it. The evidence for that is mixed, so treat the prior trend as a clue and let the breakout decide.
Where the break happens along the triangle counts as well. A traditional charting guideline says breakouts carry more weight when they come well before the apex, roughly half to three quarters of the way along.
Close to the apex the lines sit so near each other that a break can be noise.
How do you set a target and a stop on a triangle?
The usual method is the measured move. Take the height of the triangle at its widest point, then project that distance from the breakout level in the direction of the break.
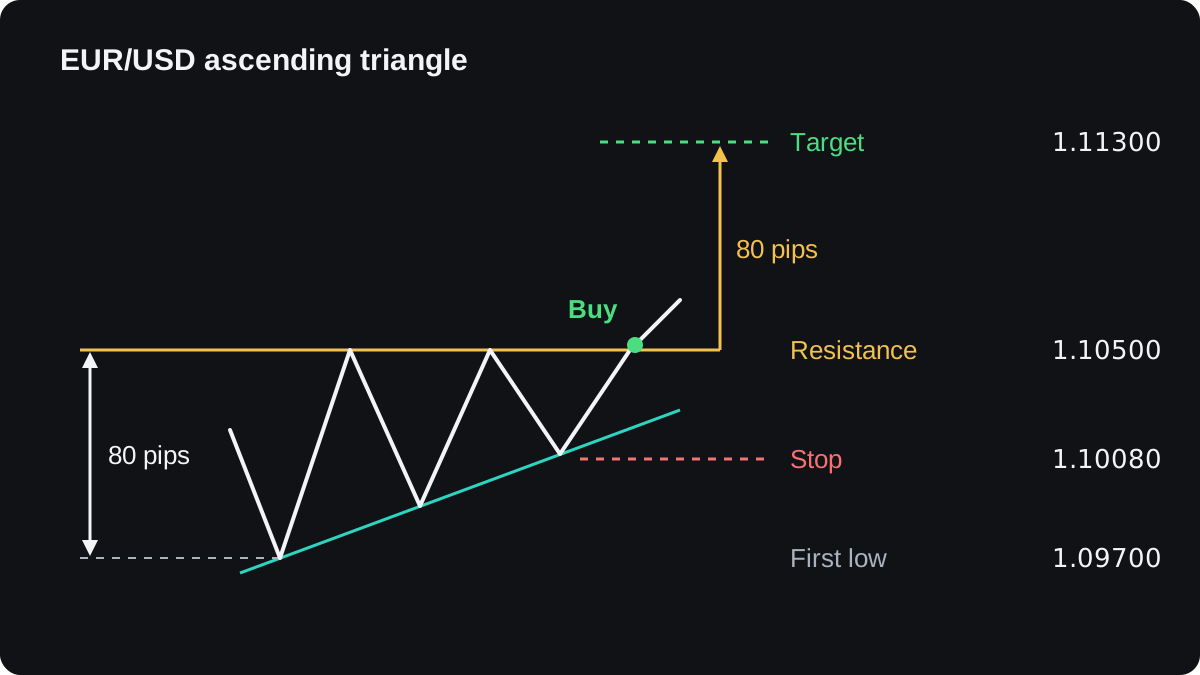
A full example on EUR/USD, with round illustrative prices in a USD account:
- Price turns down at 1.10500 twice, and the lows rise from 1.09700 to 1.09900 to 1.10100. That is an ascending triangle.
- The height is 1.10500 − 1.09700 = 0.00800, which is 80 pips.
- A candle closes above 1.10500, and you buy at 1.10520.
- The target is 1.10500 + 0.00800 = 1.11300. From entry that is 1.11300 − 1.10520 = 0.00780, or 78 pips.
- The stop goes just below the last low, at 1.10080. The risk is 1.10520 − 1.10080 = 0.00440, or 44 pips.
- With a $5,000 account and an illustrative 1% risk limit, you can lose $50. Dividing $50 by 44 pips gives at most $1.14 per pip.
- On EUR/USD, 0.01 lot is worth $0.10 per pip, so 0.11 lot is worth $1.10. The risk is 44 × $1.10 = $48.40, and the target pays 78 × $1.10 = $85.80.
The position size lesson covers steps 6 and 7 in detail. These sums leave out the spread and any commission, which make the real result slightly worse.
The target is a projection from geometry. Price can stop short of it or run far past it.
A reward of 78 pips against 44 pips of risk is about 1.8 to 1. Before costs, you would need to win more than 44 ÷ 122, about 36%, of such trades to break even. The risk-reward lesson shows how the two fit together.
Where triangle trades go wrong
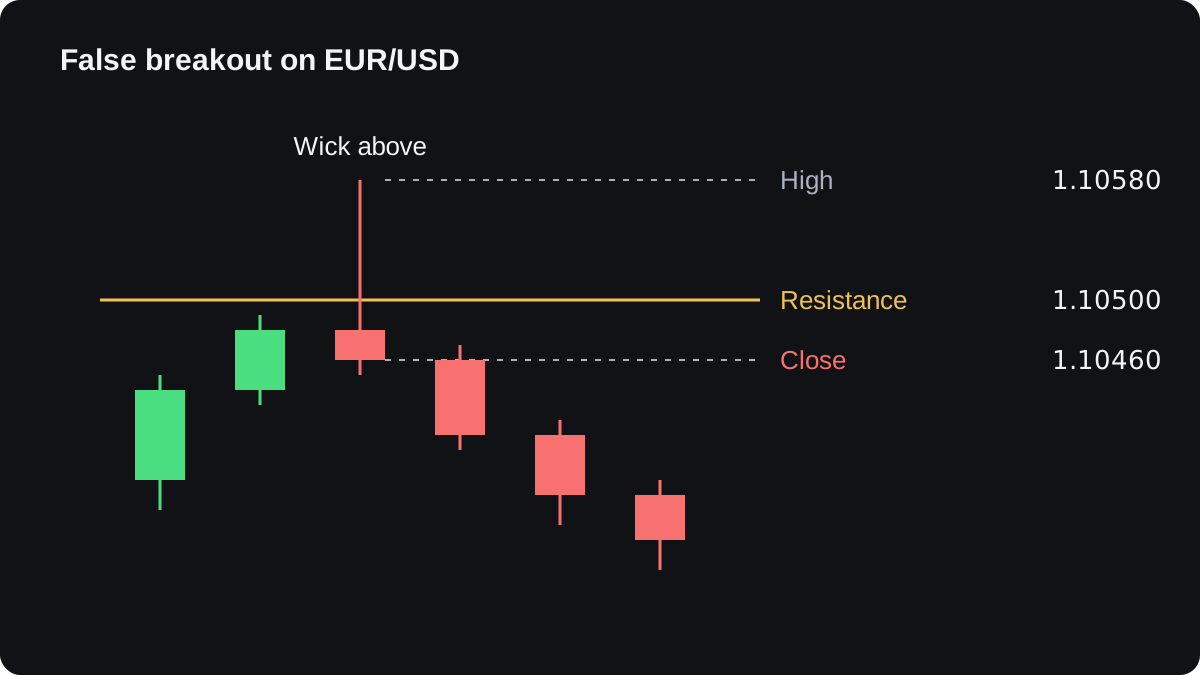
The most common failure is the false breakout. Suppose the candle that tested 1.10500 had reached 1.10580 and then closed back at 1.10460.
A buy stop order at 1.10520 would have filled on the way up. You would then be long inside the triangle as price falls back.
Waiting for a close above the line avoids that trap. The price of that patience is a worse entry when the break is real.
The false breakouts lesson covers ways to handle them. Triangles also fail in quieter ways:
- Drawing is subjective. Two traders can pick different swing points and end up with different lines and different stops.
- Patterns look cleaner in hindsight. While a triangle is forming, you cannot know which touch is the last one.
- Scheduled news can push price through either line in seconds, sometimes with slippage.
- Published studies of chart patterns report very different success rates, depending on the data used and on how the pattern is defined. No triangle tells you the direction in advance.
If you want to use triangles, test your own definition on past charts and on a demo account before risking money. The wedge patterns lesson comes next: wedges also narrow, but both of their lines slope the same way.
សំណួរ
Is an ascending triangle always bullish?
No. It is usually read as bullish because buyers keep pressing on a flat resistance, but it can break down through the rising line. Wait for a close outside the pattern before acting on it.
How many touches does a triangle need?
Most definitions ask for at least two touches on each line, so four turning points in total. More touches make the lines clearer but also bring the apex closer.
What is the difference between a triangle and a wedge?
In a triangle, the two lines slope toward each other or one of them is flat. In a wedge, both lines slope in the same direction, up or down, while still converging.
Do triangle patterns work in forex?
They appear often on forex charts, but their record is mixed and depends heavily on how you define and trade them. Use them as one input with a planned stop, and test them yourself first.
បន្តរៀន
 ជំពូក 2Head and shoulders.A head and shoulders is a chart pattern of three peaks, with the middle one highest, that can mark the end of an uptrend. The neckline joins the two lows between the peaks. Traders treat a close below it as the trigger and measure a target by projecting the head's height down from the break.
 ជំពូក 2Double tops and double bottoms.A double top is two peaks at about the same price with a dip between them; a double bottom is two lows with a bounce between. The low or high between them is the neckline. The pattern only counts once price closes beyond the neckline, and it can still fail after that.
 ជំពូក 2Rising and falling wedges.A wedge is a chart pattern where price swings between two trend lines that slope the same way and move closer together. A rising wedge slopes up and is usually read as bearish. A falling wedge slopes down and is usually read as bullish. Neither is reliable on its own, so traders wait for a confirmed break.
 ជំពូក 2Flags and pennants.A flag is a short, narrow channel that slopes against a sharp price move, called the pole. A pennant is the same pause shaped like a small triangle. Traders read both as a rest before the move continues. A common plan trades the break in the pole's direction and projects the pole's length as a rough target.
 ជំពូក 2Rectangles.A rectangle is a sideways range where price bounces between two flat levels, resistance above and support below. It ends when price closes outside the box. Traders often sketch a target by adding the box's height to the broken level, but a rectangle can break either way and the break can fail.
 ជំពូក 2Chart patterns cheat sheet.Most chart patterns share one set of rules. Enter when a candle closes beyond the pattern's boundary, put the stop beyond the opposite side or the last swing, and aim for the pattern's height projected from the breakout, or the pole's length for flags and pennants. This sheet gives each pattern's entry, stop and target.

