Pivot points cheat sheet.
A pivot point is the average of the previous period's high, low and close: P = (H + L + C) ÷ 3. Standard levels come from P and the range, Fibonacci pivots sit 38.2%, 61.8% and 100% of the range from P, and Camarilla levels sit near the previous close. None predicts where price will turn.
Nội dung này hiện chỉ có bản tiếng Anh.

This page collects the pivot formulas and setups from this chapter. All prices are round illustrative numbers for EUR/USD, chosen to show the arithmetic. They say nothing about where the pair trades today.
What goes into a pivot calculation?
Every method uses three prices from the previous period: its high (H), low (L) and close (C). The range is H − L.
Daily pivots use yesterday's prices and suit intraday trades. Weekly and monthly pivots use last week's or last month's prices and suit longer holds.
Many brokers end the daily candle at 17:00 New York time, the usual end of the forex trading day. Others do not, and a short Sunday candle can shift Monday's levels, so platforms may disagree.
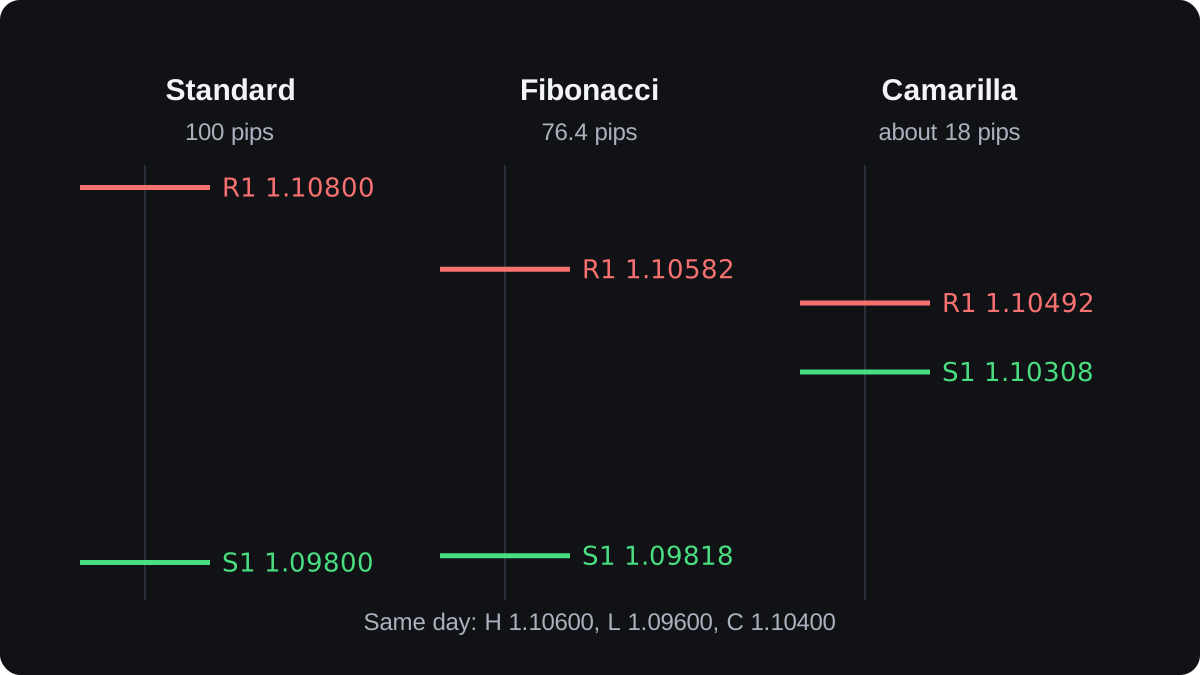
The example day is H = 1.10600, L = 1.09600 and C = 1.10400, a range of 0.01000, or 100 pips.
Standard pivot formulas
The standard method, also called floor pivots, is a usual platform default. What are pivot points? explains the idea behind it.
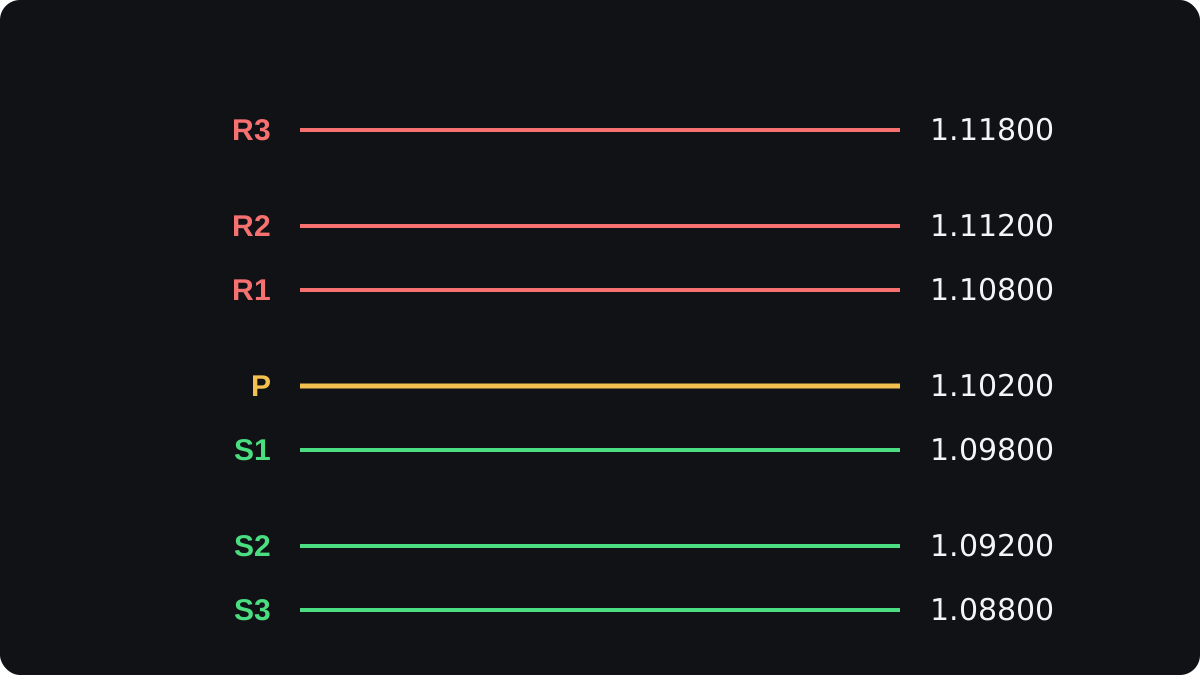
The pivot is P = (1.10600 + 1.09600 + 1.10400) ÷ 3 = 3.30600 ÷ 3 = 1.10200.
| Level | Formula | Example |
|---|---|---|
| R3 | H + 2 × (P − L) | 1.11800 |
| R2 | P + (H − L) | 1.11200 |
| R1 | (2 × P) − L | 1.10800 |
| P | (H + L + C) ÷ 3 | 1.10200 |
| S1 | (2 × P) − H | 1.09800 |
| S2 | P − (H − L) | 1.09200 |
| S3 | L − 2 × (H − P) | 1.08800 |
Check R1: 2 × 1.10200 = 2.20400, and 2.20400 − 1.09600 = 1.10800. R2 sits one full range above P, and R3 one full range above R1.
On a JPY pair the pip is 0.01, so a gap of 0.90 on USD/JPY is 90 pips.
Fibonacci and Camarilla formulas
Both reuse H, L and C, and the lesson on standard, Fibonacci and Camarilla pivots compares them.
Fibonacci pivots add 0.382, 0.618 and 1.000 times the range to P for R1 to R3, and subtract the same for S1 to S3. So R1 = 1.10200 + 0.00382 = 1.10582.
Camarilla levels centre on the close: R1 = C + (H − L) × 1.1 ÷ 12, with ÷ 6, ÷ 4 and ÷ 2 for R2, R3 and R4. Supports subtract the same amounts, so R3 = 1.10400 + 0.00275 = 1.10675.
| Level | Fibonacci | Camarilla |
|---|---|---|
| R4 | not used | 1.10950 |
| R3 | 1.11200 | 1.10675 |
| R2 | 1.10818 | 1.10583 |
| R1 | 1.10582 | 1.10492 |
| P | 1.10200 | not used |
| S1 | 1.09818 | 1.10308 |
| S2 | 1.09582 | 1.10217 |
| S3 | 1.09200 | 1.10125 |
| S4 | not used | 1.09850 |
Camarilla values are rounded to five decimals. Platforms vary, so check yours once against a pivot point calculator.
Standard R1 and S1 are 100 pips apart, Fibonacci 76.4 pips and Camarilla about 18 pips.
Setups that use pivot levels
These rows summarise how to trade with pivot points. Each is an example rule set to test on your own pair and timeframe. None is a recommendation.
| Setup | Trigger | Stop and target |
|---|---|---|
| Bias | Above P leans to buys, below P to sells | Direction only |
| Bounce | Price turns at S1 or R1 in a quiet range | Stop beyond level, target P |
| Break | Close beyond R1 or S1 in a trend | Stop back inside, target R2 or S2 |
| Camarilla fade | Price turns at R3 or S3 | Stop beyond R4 or S4, target the close |
| Camarilla breakout | Close beyond R4 or S4 | Stop back inside R4 or S4 |
Treat each level as a zone a few pips wide. A candle close beyond it says more than a brief poke, as the bounce or break lesson explains.
A worked bounce trade at S1
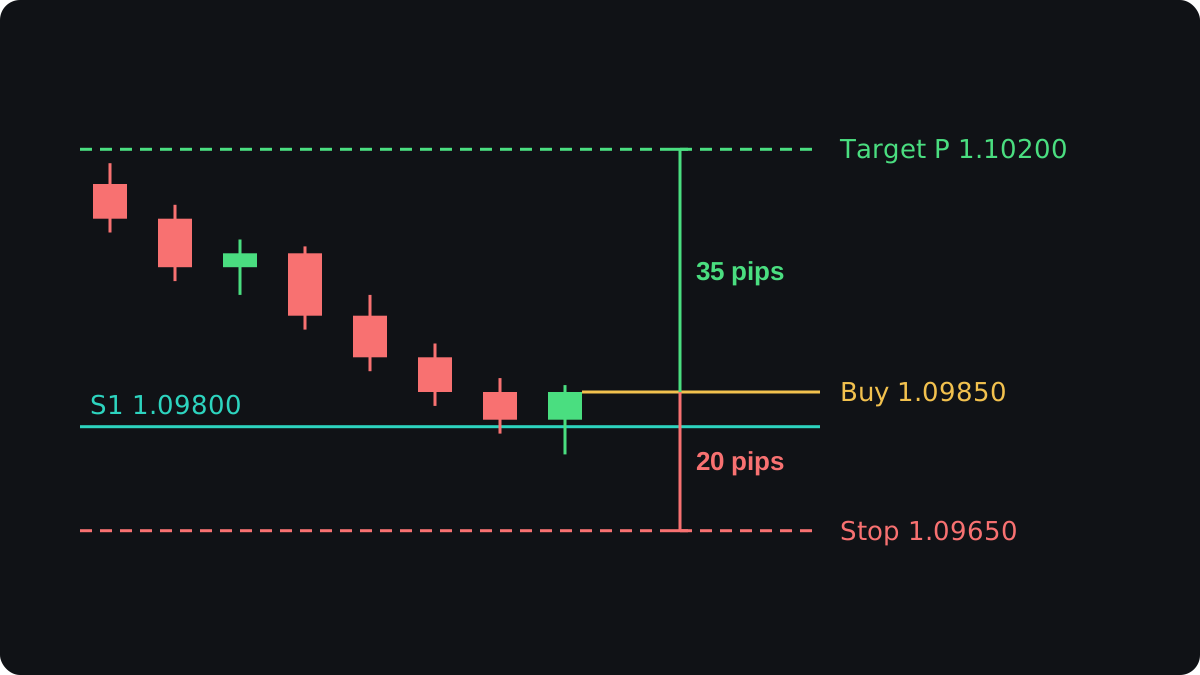
In a quiet session, EUR/USD falls to the standard S1 at 1.09800.
- A 15-minute candle dips to 1.09760 and closes at 1.09850. You buy 0.10 lot at 1.09850.
- The stop goes at 1.09650, below the wick: 1.09850 − 1.09650 = 0.00200, or 20 pips of risk.
- The target is P at 1.10200: 1.10200 − 1.09850 = 0.00350, or 35 pips.
- On 0.10 lot of EUR/USD a pip is worth $1, so you risk $20 to make $35, a risk-reward ratio of 1.75.
- On a $2,000 account, $20 is 1% of the balance.
These sums ignore spread and commission, which shrink the gain and enlarge the loss. Which level price reaches first is unknown at entry.
Where pivot points fail
Pivots are arithmetic on old prices. A central bank decision or a jobs report can carry price through several levels without a pause.
Bounce rules suit ranges and break rules suit trends, and the levels cannot tell you which kind of day is coming.
Any effect may come partly from many people watching the same numbers. Careful public evidence that pivots predict turns better than other levels is thin, so test any rule on your own data.
A daily and a weekly level within a few pips of each other is worth marking, though it is still only a guess.
Câu hỏi thường gặp
What is the formula for a pivot point?
P = (H + L + C) ÷ 3, using the previous period's high, low and close. With H 1.10600, L 1.09600 and C 1.10400, P is 1.10200.
Which pivot point method is best?
None has been shown to be better in general. Pick one and test it on your own pair.
Should I use daily or weekly pivots?
Daily pivots suit trades closed within a day. Weekly and monthly pivots give wider levels for trades held several days.
Why are my pivot levels different from another website's?
Usually the daily close is taken at a different hour or a Sunday candle is included. A different method or rounding can also shift levels.
Do pivot points work on gold and indices?
The arithmetic works on any market with a high, low and close. Whether the levels help there is a separate question to test.
Học tiếp
 Chương 3What are pivot points?Pivot points are support and resistance levels calculated from the previous period's high, low and close. The main pivot, P, is the average of those three prices. Formulas built from P and the previous high and low then give resistance levels R1 to R3 above it and support levels S1 to S3 below it, fixed for the whole period.
 Chương 3Standard, Fibonacci and Camarilla pivots.All three methods use the previous day's high, low and close. Standard pivots set P = (H + L + C) ÷ 3 and build levels from P and the range. Fibonacci pivots place levels 38.2%, 61.8% and 100% of the range either side of P. Camarilla pivots cluster tightly around the close using the constant 1.1.
 Chương 3How to trade with pivot points.Pivot points give two common trade setups. In a range, traders buy near S1 or sell near R1 and target the central pivot. On a breakout, they trade a candle close through R1 or S1 toward R2 or S2. In both, the stop sits just beyond the level, so a failed level costs a small, planned loss.

