Retail positioning as a contrarian signal.
Retail positioning data shows what share of one broker's clients are long or short a pair. Contrarian traders read it in reverse: a crowd heavily long hints the price may fall, since retail traders tend to buy into declines. It is a weak, one-broker signal that can stay extreme for weeks, so it needs a chart and testing.
Nội dung này hiện chỉ có bản tiếng Anh.

Some brokers publish a running count of what their own clients hold on each pair. A page might say that 75% of clients trading EUR/USD are long and 25% are short.
People who use these numbers often read them backwards. A crowd that is heavily long is taken as a hint that the price may fall, and a crowd heavily short as a hint it may rise.
The previous lesson, on the Commitments of Traders report, tracked positions in US futures markets. This one looks at small retail accounts, the other end of the market.
What does retail positioning data show?
Imagine 1,000 of a broker's clients have an open EUR/USD trade. If 700 of them are long and 300 are short, the page shows 70% long and 30% short.
That snapshot is retail positioning data, also called client sentiment: the split of open trades held by one broker's retail clients on one instrument. The two percentages always add up to 100.
Long means you bought and gain if the price rises. Short means you sold and gain if it falls. The long and short glossary entry has more on both terms.
Sources measure the split in two ways. Some count traders, so each account is one vote whatever its size. Others count volume, so a 2 lot trade weighs twenty times as much as a 0.1 lot trade.
Many pages also show the ratio of longs to shorts and how the split changed over the last day or week. Update speed and method differ between sources, so read the notes on the page before using the numbers.
Why would anyone read the crowd in reverse?
The reverse reading rests on a habit seen in retail accounts. Studies of broker data have reported that individual traders tend to buy after prices fall and sell after they rise, trading against the recent move.
If that habit holds, the crowd grows more long as a downtrend goes on. Each dip looks cheap to new buyers, while traders already long hold their losing positions in the hope of a recovery.
Here is an illustrative case. Over five weeks EUR/USD falls from 1.1000 to 1.0800, a drop of 200 pips. Over the same weeks the share of clients long climbs from 50% to 75%.
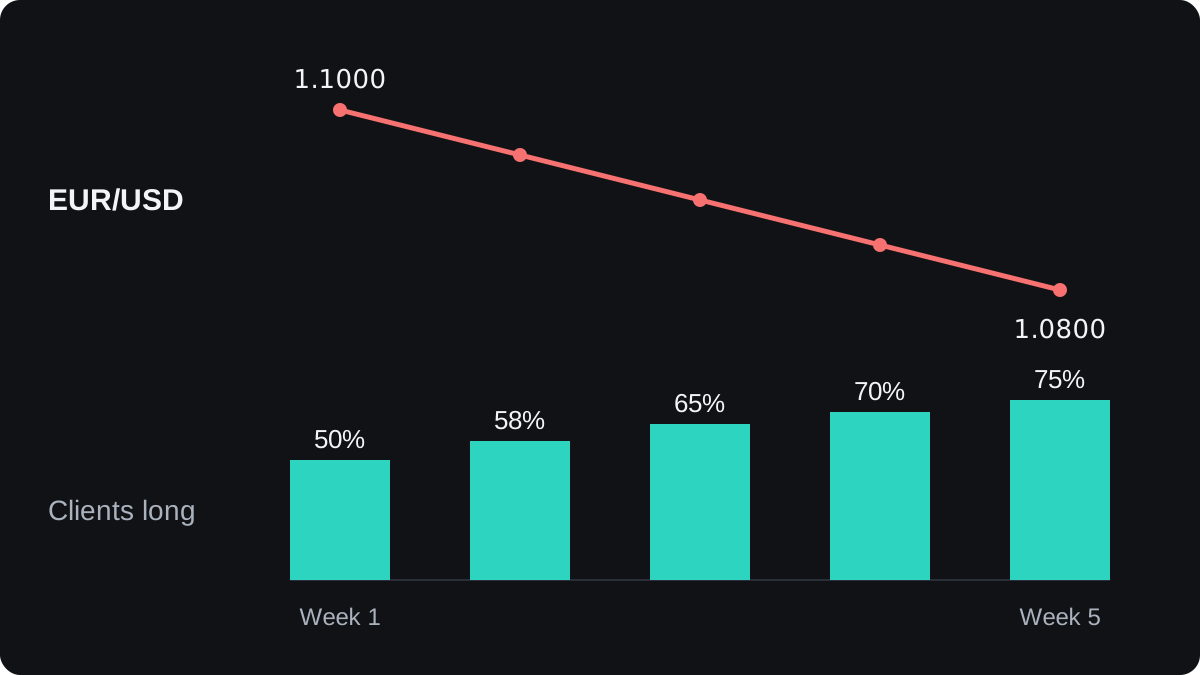
A contrarian reads that chart as a crowd that leaned the wrong way for the whole fall. The conclusion is that the downtrend may have further to go, because the people betting on a turn have not given up yet.
There is a second argument. Every open long must one day be closed with a sell. If many of those longs have stop losses below the price, a break lower can trigger them and add to the selling.
Both arguments describe tendencies. Neither tells you when a move will start or whether the crowd is wrong this time.
Worked example: counting traders versus counting volume
The two ways of measuring can point in opposite directions. Take the same 1,000 EUR/USD accounts, with illustrative trade sizes. A lot is 100,000 units of the base currency.
- Long side: 700 accounts holding 0.5 lot each on average, so 700 × 0.5 = 350 lots.
- Short side: 300 accounts holding 1.75 lots each on average, so 300 × 1.75 = 525 lots.
- By traders: 700 ÷ 1,000 = 70% long and 300 ÷ 1,000 = 30% short.
- By volume: the total is 350 + 525 = 875 lots, so 350 ÷ 875 = 40% long and 525 ÷ 875 = 60% short.
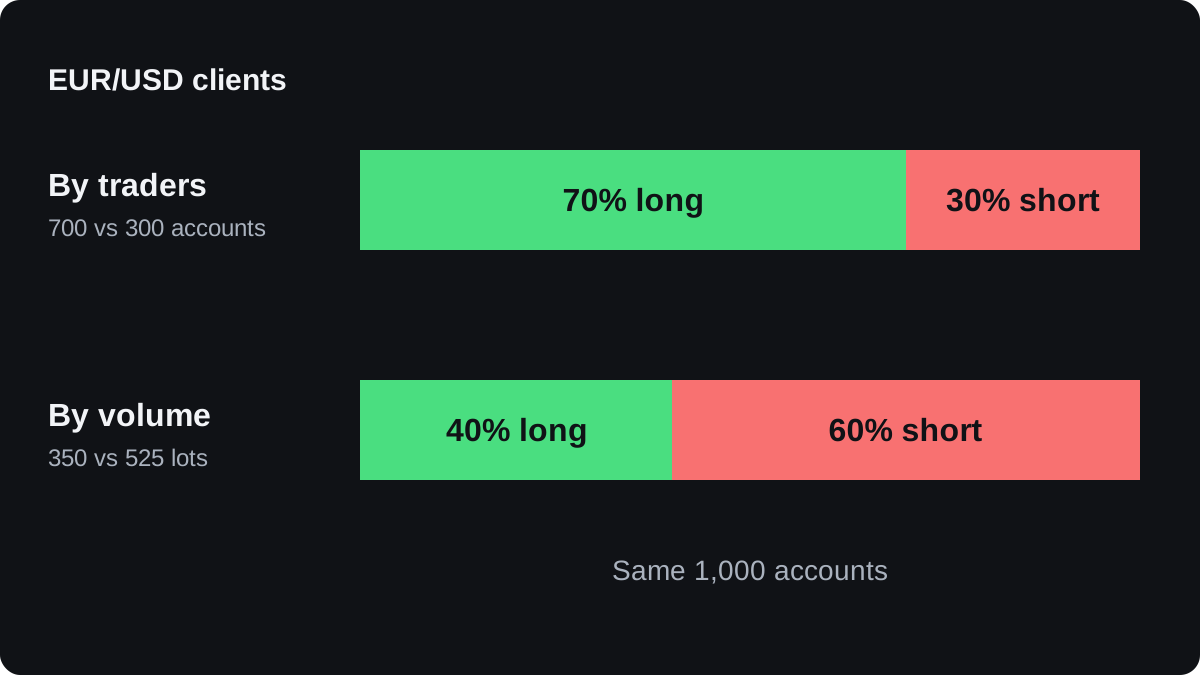
In money terms, the short side holds 525 × 100,000 = 52.5 million euros of positions. The long side holds 350 × 100,000 = 35 million euros.
By head count the crowd looks heavily long, and by size it leans short. A reverse reading of the first figure points to selling, and of the second to buying, from exactly the same accounts.
Ratios show the same gap. By traders, longs outnumber shorts 700 ÷ 300 = 2.33 to 1. By volume, the ratio is 350 ÷ 525 = 0.67 to 1, so there is less long money than short money.
Find out which measure a page uses before you read anything into it. When a source shows both and they disagree, the crowd is split, and a split crowd says little either way.
How traders put the reading to use
Readings near 50% show a balanced crowd and carry little information. Contrarian users look for one-sided extremes, and the cut-off is a personal choice. This lesson uses 70% on one side only as an illustration.
The change adds information the level lacks. A move from 55% to 75% long in one week, while the price falls, shows the crowd adding to losing trades. A reading stuck at 75% for months says much less.
The reading is then checked against the price chart. A crowd 75% long in a falling market is fighting the trend, so a contrarian short goes with the move.
A crowd 75% long in a rising market is following the trend. A contrarian short there would bet against both the crowd and the trend, a far weaker case.
An illustrative rule set: sell only when the price is below its 50-day moving average and at least 70% of clients are long, with a stop loss above the last swing high.
That shows how the pieces fit together. It has not been tested, and it is not a recommendation. You would need to backtest it and size each trade to a fixed risk per trade before trusting it with money.
Where the contrarian signal fails
One broker is a small window. Its clients may behave differently from other brokers' clients, and retail trading is a small part of global forex turnover, so the crowd you see does not set the price.
The crowd is sometimes right. In a ranging market, buying dips and selling rallies tends to pay, so trading against a crowd that does this can lose again and again.
Extremes can also last. A reading can sit at 75% long for weeks while the price drifts sideways, and the number says nothing about when a move comes, or whether one comes at all.
The evidence is thin. Much of what is written about this signal comes from firms that publish or sell the data, and independent tests of whether it predicts prices after trading costs are limited.
Positions also hide intent. A client long on one broker may be short the same pair elsewhere as a hedge, and the published split cannot see that.
Câu hỏi thường gặp
Where can I find retail sentiment data?
Some brokers publish it on their websites or trading platforms, and some trading-data sites show figures from accounts linked to them. Check what each source counts and how often it updates.
Is retail positioning data a buy or sell signal?
On its own, no. It describes what one group of clients holds, and it needs a price chart and a tested plan before it can support a trade.
What percentage counts as extreme?
There is no agreed number. Some readers pick 70% on one side and others 80%, and the change over recent days often tells you more than the level.
How is this different from the COT report?
The COT report covers positions in US futures markets, sorted into trader groups, and comes out weekly with a delay. Broker sentiment covers small retail accounts at one broker and often updates during the day.
Why do retail traders end up on the wrong side?
One explanation is the habit of buying after falls and holding losing trades in the hope of a recovery. That is a tendency, and it does not make the crowd wrong on any single trade.
Học tiếp
 Chương 8Risk-on and risk-off.Risk-on is a market mood where investors buy shares, commodities and higher-yielding currencies such as the Australian dollar. Risk-off is the opposite: fear rises and money moves toward safe havens, mainly the Japanese yen, the Swiss franc and often the US dollar. The pattern is a tendency, and interest rates or local news can break it.
 Chương 8The Commitments of Traders report.The Commitments of Traders (COT) report is a weekly breakdown, published by the US Commodity Futures Trading Commission, of who holds long and short positions in US futures markets, including currency futures. It shows positions as of Tuesday and usually comes out on Friday, so it is three days old on arrival and leaves out over-the-counter forex.

