Risk-reward ratio and win rate.
The risk-reward ratio compares what a trade can lose with what it aims to win, and the win rate is the share of trades that win. Together they decide whether a strategy pays. The win rate you need to break even is risk divided by risk plus reward, so a 1:2 trade needs 33.3% before costs.
Nội dung này hiện chỉ có bản tiếng Anh.

Every trading result rests on two numbers. One is how much a typical win pays compared with a typical loss. The other is how often you win. Either one can look good while the strategy loses money.
The examples below use one trade sized with the 1% rule from the lesson on how much to risk per trade. All prices are round and illustrative.
What is a risk-reward ratio?
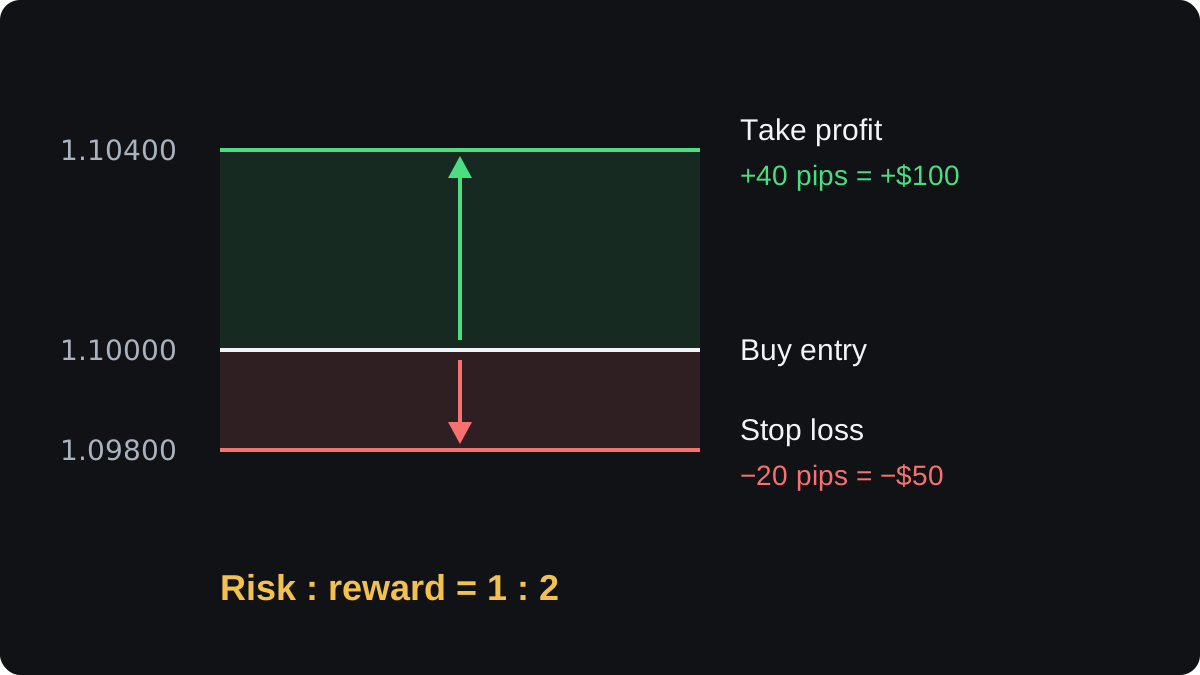
Say you have a $5,000 account and buy 0.25 lot of EUR/USD at 1.10000. Your stop loss sits at 1.09800 and your take profit at 1.10400.
The stop is 20 pips below entry and the target is 40 pips above. On 0.25 lot, which is 25,000 euros, a pip is worth 25,000 × 0.0001 = $2.50.
So the trade risks 20 × $2.50 = $50, which is 1% of the account. It aims to make 40 × $2.50 = $100.
The risk-reward ratio is the planned loss compared with the planned gain. Here it is $50 to $100, written 1:2: you risk one unit to make two.
Some platforms and writers flip the order and call the same trade 2:1. Check which way round a ratio is written before you compare it with anything. This lesson always puts risk first.
Traders also call the amount risked on a trade R. This trade risks 1R and targets 2R, so a full win is +2R and a full loss is −1R. Thinking in R lets you compare trades of different sizes.
What does win rate tell you?
Close 50 trades, count 20 winners, and your win rate is 20 ÷ 50 = 40%. It is the share of closed trades that made money.
A high win rate feels good, yet it says nothing about the size of each win or loss. Say a strategy wins 8 trades out of 10 at $20 each and loses the other 2 at $100 each.
That is an 80% win rate, and the 10 trades still end at 8 × $20 − 2 × $100 = $160 − $200 = −$40.
The reverse also holds. Win 3 trades in 10 at $150 each, lose 7 at $50 each, and the result is $450 − $350 = +$100 at a win rate of only 30%.
What win rate do you need to break even?
Take the 1:2 trade and place it three times. You win once and lose twice: +$100 and 2 × −$50 = −$100. You end exactly flat.
That is 1 win in 3 trades, or 33.3%. It is the breakeven win rate for a 1:2 ratio. Over many trades, before costs, a win rate below it loses money and one above it makes money.
For any ratio, the formula is:
Breakeven win rate = risk ÷ (risk + reward)
For 1:2 that is 1 ÷ (1 + 2) = 33.3%. For 1:3 it is 1 ÷ 4 = 25%. A trade that risks $50 to make $25 is 1:0.5, and it needs 1 ÷ 1.5 = 66.7%.
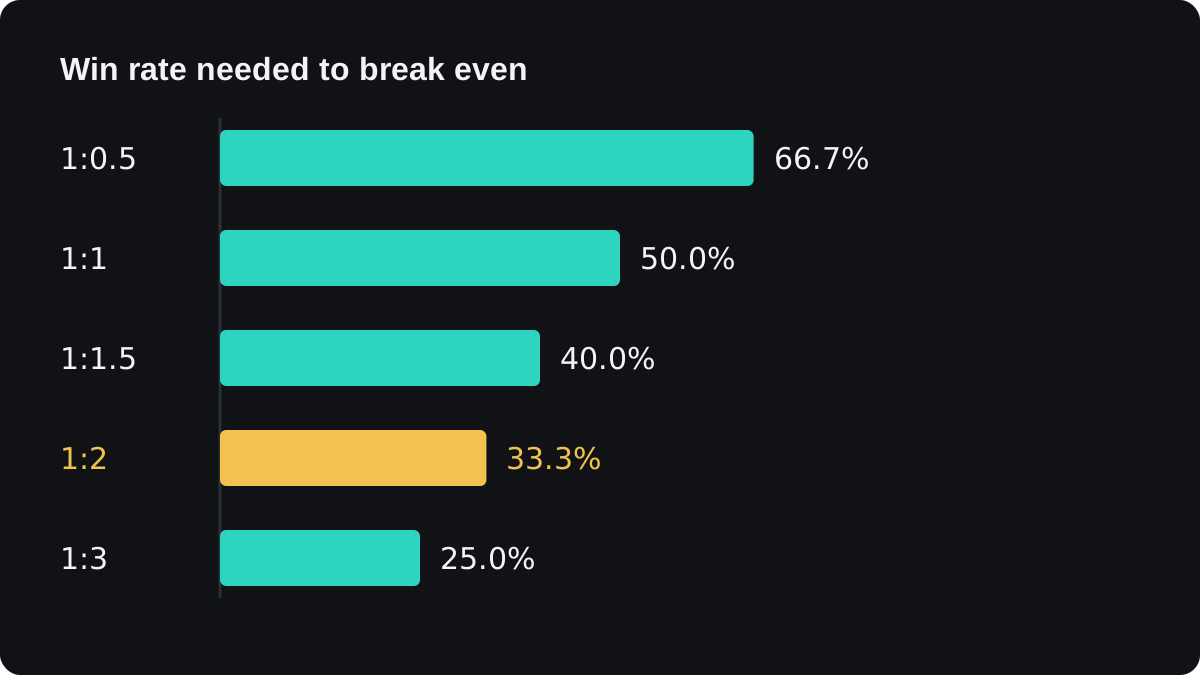
A bigger reward lowers the bar, which is the reason behind the rule of thumb to aim for 1:2 or more. The maths does not demand any particular ratio, though. A 1:0.5 strategy that truly wins 75% of the time makes money.
How do ratio and win rate combine into expectancy?
The breakeven win rate shows where the line is. Expectancy shows how far above or below it you are: the average result per trade over many trades.
Expectancy = (win rate × average win) − (loss rate × average loss)
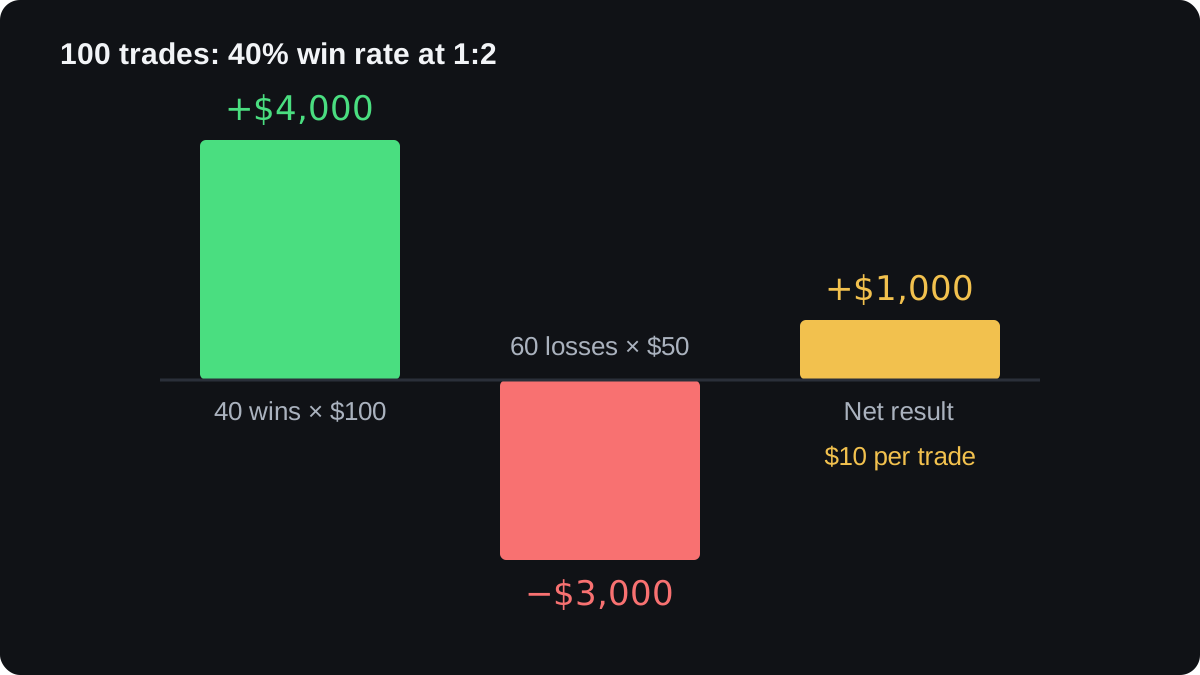
Here is the 1:2 trade at a 40% win rate, repeated 100 times:
- Wins: 40 trades × $100 = $4,000.
- Losses: 60 trades × $50 = $3,000.
- Net result: $4,000 − $3,000 = $1,000.
- Per trade: $1,000 ÷ 100 = $10, which is 0.2R.
- Check with the formula: 0.40 × $100 − 0.60 × $50 = $40 − $30 = $10.
The table holds the win rate at 40% and changes only the ratio, with expectancy in R per trade, before costs:
| Ratio (risk:reward) | Breakeven win rate | Expectancy at 40% wins |
|---|---|---|
| 1:0.5 | 66.7% | −0.4R |
| 1:1 | 50.0% | −0.2R |
| 1:1.5 | 40.0% | 0.0R |
| 1:2 | 33.3% | +0.2R |
| 1:3 | 25.0% | +0.6R |
This table assumes the win rate stays at 40% whatever the target. In practice a target three times the stop distance sits further away, so price reaches it less often. Test the ratio and the win rate together.
You can try other combinations on the risk-reward visualizer.
How do trading costs change the result?
Every trade pays its costs, such as the spread or a commission, whether it wins or loses. Wins shrink and losses grow, so the breakeven win rate rises.
Suppose the round trip costs 1 pip. On 0.25 lot that is $2.50. A win now nets $100 − $2.50 = $97.50, and a loss costs $50 + $2.50 = $52.50.
The breakeven win rate becomes $52.50 ÷ ($52.50 + $97.50) = $52.50 ÷ $150 = 35.0%. At 40% wins, expectancy falls to 0.40 × $97.50 − 0.60 × $52.50 = $39 − $31.50 = $7.50 per trade.
Tight stops feel the same cost far more. Risk the same $50 with a 5 pip stop and a 10 pip target on 1.00 lot, where a pip is worth $10. The 1 pip cost is now $10 a trade.
A win nets $100 − $10 = $90 and a loss costs $50 + $10 = $60. The breakeven win rate is $60 ÷ $150 = 40.0%, so the 40% win rate that made money before now only breaks even.
| Stop and target | Cost per trade | Net win | Net loss | Breakeven win rate |
|---|---|---|---|---|
| 20 and 40 pips | $0.00 | $100.00 | $50.00 | 33.3% |
| 20 and 40 pips | $2.50 | $97.50 | $52.50 | 35.0% |
| 5 and 10 pips | $10.00 | $90.00 | $60.00 | 40.0% |
Slippage, a fill at a worse price than you asked for, pushes the numbers the same way. The lesson on the cost of one trade shows how to add up the full cost before you run these sums.
Why measured numbers can mislead you
A planned ratio describes the orders you set, and your results may differ. If you set a 1:2 target but usually close winners early at +20 pips, your real ratio is 1:1 and your breakeven win rate is 50%.
Measure both numbers from closed trades in a trading journal, using your average win and average loss. Those are the figures expectancy needs.
Small samples mislead too. Say you count 12 wins in 30 trades, a 40% win rate. A standard 95% statistical range puts the true long-run rate anywhere from the mid 20s to the high 50s in percent.
That range includes 33.3%, the breakeven for 1:2, so 30 trades cannot tell you whether such a strategy pays. This is why backtesting needs a large number of trades before the result means much.
A positive expectancy still brings losing runs. At a 40% win rate, each trade has a 60% chance of losing. If trades are independent, five losses in a row have a chance of 0.6 × 0.6 × 0.6 × 0.6 × 0.6 = 7.8%.
Over 100 trades, a run of five or more losses somewhere along the way is likely. At $50 each, five losses cost $250, or 5% of the $5,000 account, the kind of dip covered in drawdown and recovery.
Câu hỏi thường gặp
What is a good risk-reward ratio?
No single ratio is good on its own. A ratio only means something next to the win rate you actually achieve with it, after costs. A ratio of 1:2 is a frequent starting point because it breaks even at 33.3% before costs.
What win rate do I need with a 1:2 risk-reward ratio?
At least 33.3% to break even before costs, since 1 ÷ (1 + 2) = 0.333. Costs push that higher: in this lesson's example, a 1 pip cost on a 20 pip stop raises it to 35.0%.
Can you make money with a win rate under 50%?
Yes, if your average win is large enough compared with your average loss. At 40% wins and a 1:2 ratio, expectancy is +0.2R per trade before costs.
Is a higher risk-reward ratio always better?
No. A more distant target is usually hit less often, so the win rate tends to fall as the ratio rises. Judge the two numbers together through expectancy.
How do I calculate my real risk-reward ratio?
Divide your average winning trade by your average losing trade, using closed trades from your journal. An average win of $80 and an average loss of $50 give a real ratio of 1:1.6.
Học tiếp
 Chương 1What is risk management in trading?Risk management is the set of rules, decided before you place an order, that limits how much you can lose on one trade and in total. It covers risk per trade, stop placement, position size and total exposure. Its job is keeping you trading through losing streaks, because no method wins every trade.
 Chương 1Drawdown and the maths of recovery.A drawdown is the fall in your account from its highest point to a later low, shown as a percentage. Losses and gains are not symmetric: after losing 50% you need a 100% gain to break even, because the gain is earned on a smaller balance. The gain needed is the loss divided by one minus the loss.
 Chương 1How much to risk per trade.Risk per trade is the money you lose if a trade hits its stop loss. The fixed-percentage rule sets it as a share of your current balance, commonly 1% to 2%, so each loss shrinks the next bet. At 1%, ten losses in a row take a $10,000 account to about $9,044.

