How to draw a trend line.
To draw an uptrend line, connect two or more rising swing lows and extend the line to the right. For a downtrend, connect falling swing highs. Two points draw the line, a third reaction is the usual sign it is confirmed, and a candle closing clearly beyond it usually means the line has stopped counting.
هذا المحتوى متاح حاليًا باللغة الإنجليزية فقط.

Picture a pair that dips and bounces, where each dip stops a little higher than the one before. A straight line under those dips is a trend line, and it turns a rising floor into something you can measure.
A trend line is a sloped line drawn through two or more swing points in the direction of the trend. It is support or resistance that moves with time, unlike the flat levels in the support and resistance lesson.
Which points does a trend line connect?
In an uptrend, price makes higher lows: each pullback ends above the last one. An uptrend line joins those lows and runs under price, so it behaves like rising support.
In a downtrend, price makes lower highs: each rally fails below the last one. A downtrend line joins those highs and runs above price, like falling resistance.
The points you join are swing lows and swing highs, the turning points described in market structure. A line through candles in the middle of a move, where nothing turned, tells you little.
How do you draw an uptrend line?
Your platform's trend line tool does the drawing, and you choose the points:
- Find a clear swing low where a pullback ended. Call it A.
- Find a later swing low that sits higher than A. Call it B.
- Draw a straight line from A through B and extend it to the right.
- Check that price did not cut through the line between A and B. If it did, choose different swings.
Here is a worked example on a one hour EUR/USD chart. The prices are round and illustrative, and candle A is counted as candle 0.
- Low A is 1.08000. Twenty candles later, low B is 1.08600.
- The rise is 1.08600 minus 1.08000 = 0.00600, which is 60 pips.
- Over 20 candles, the line climbs 60 ÷ 20 = 3 pips (0.00030) per candle.
- Ten candles after B, at candle 30, the line sits at 1.08600 + 10 × 0.00030 = 1.08900.
- Price dips to 1.08910 there and turns up. That low, C, is 1 pip above the line.
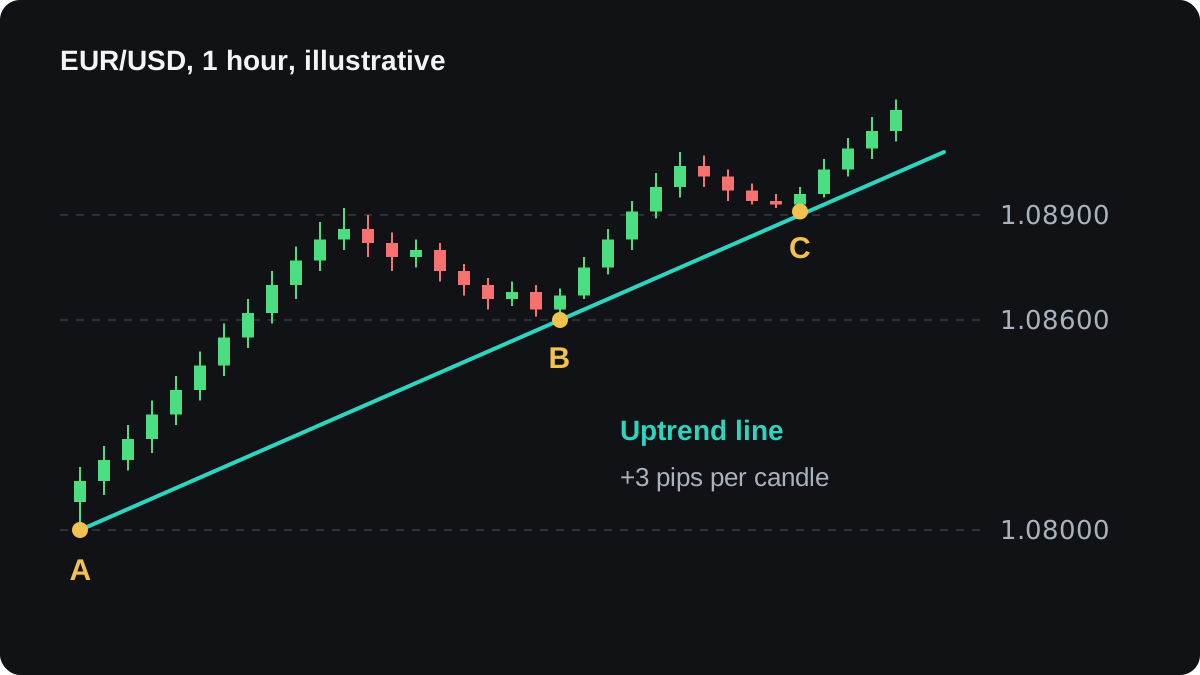
Knowing the slope tells you where the line will be before price arrives. That is the number you need if you set an alert or an order near the line.
How do you draw a downtrend line?
The method flips for a falling market. You join swing highs, each lower than the last, and the line runs down to the right above the candles.
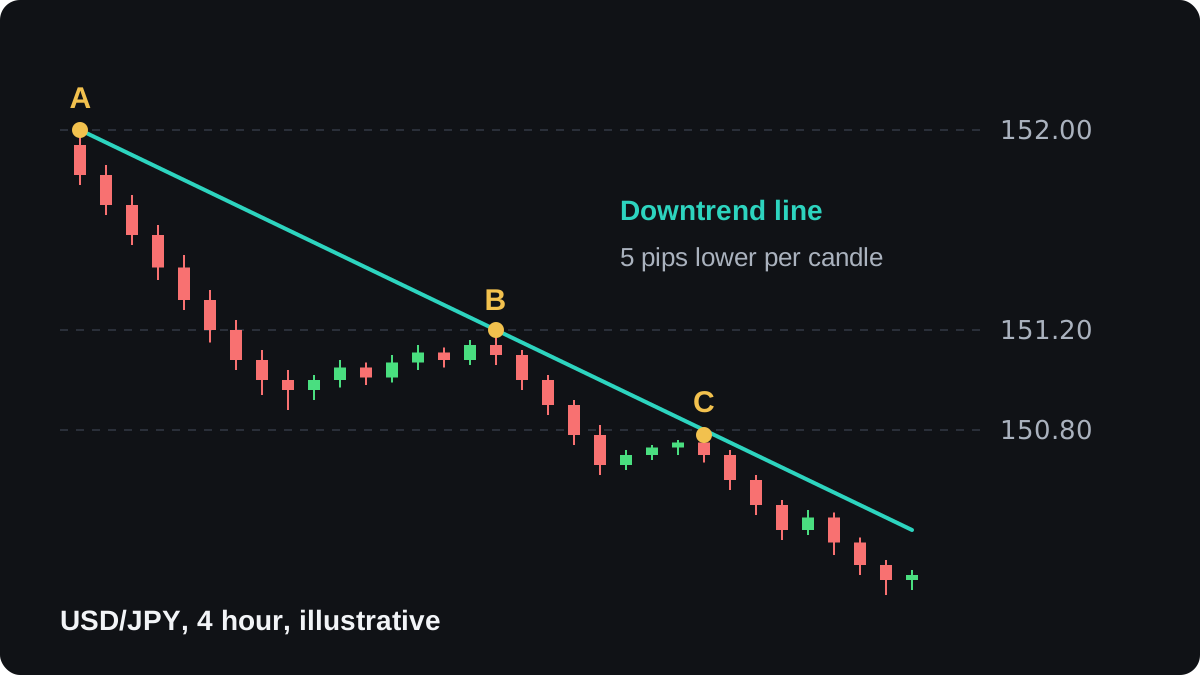
This example uses a four hour USD/JPY chart, again with illustrative prices. On a yen pair a pip is 0.01.
- High A is 152.00. Sixteen candles later, high B is 151.20.
- The drop is 152.00 minus 151.20 = 0.80, which is 80 pips.
- Over 16 candles, the line falls 80 ÷ 16 = 5 pips (0.05) per candle.
- Eight candles after B, the line sits at 151.20 minus 8 × 0.05 = 150.80.
- A rally stalls at 150.78, 2 pips under the line, and price turns down. That high is C.
How many touches does a trend line need?
Any two points can be joined by a line, so two touches give you only a guess. A common convention is to call the line confirmed once price reacts at a third point, as at C in both examples.
Spacing matters as well. Three lows packed into a few candles are close to a single event, while lows spread across many candles show price respecting the line over time.
No number of touches guarantees that the next one holds. A line with four touches can break on the fifth.
Steepness changes how a line behaves. A very steep line needs price to keep moving fast, so a short pause can break it. A shallow line survives pauses but sits far from price and gets tested less often.
You may meet rules about an ideal angle, such as 45 degrees. The angle on screen changes when you stretch or squeeze the chart, so a fixed angle has no real meaning.
Trend lines describe what price has already done. Evidence that they predict moves on their own is weak, partly because two people looking at one chart often draw different lines.
Should you draw through wicks or candle bodies?
Each swing gives you two possible anchors: the tip of the wick or the edge of the body. Wicks record every price traded, and bodies ignore brief spikes and track opens and closes.
The candlestick lesson explains both parts. Either choice is fine if you use it for every point on the line. Mixing a wick for one anchor and a body for another lets you force a line through almost any chart.
Treat the line as a narrow band. Price rarely meets a sloped line to the exact pip, which is why C counted at 1 pip away. The idea from support and resistance zones applies here too.
Chart scale can move a line on long charts. Over a large percentage move, a logarithmic scale places the line differently from a linear one, though on a few days or weeks of a currency pair the difference is small.
When does a trend line stop counting?
A common rule is that a line breaks when a candle closes clearly beyond it. A wick that pokes through, with the candle closing back on the line's original side, leaves the line in place.
The EUR/USD example shows both cases:
- At candle 36, the line sits at 1.08000 + 36 × 0.00030 = 1.09080.
- A wick drops to 1.09040, 4 pips below it, but the candle closes at 1.09150, above the line. The line still holds.
- At candle 40, the line sits at 1.08000 + 40 × 0.00030 = 1.09200.
- That candle closes at 1.09050, 15 pips below the line. Under a close rule, the line is broken.
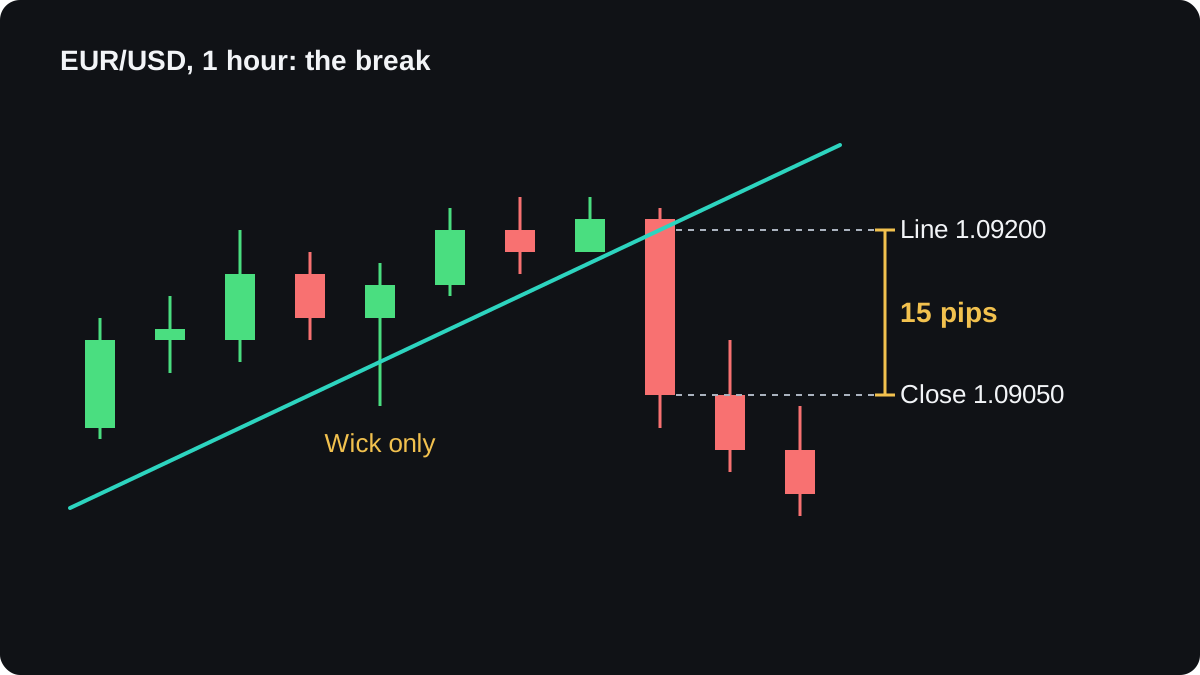
You can add a filter, such as a close a set number of pips beyond the line or two closes in a row. No filter suits every pair, and one sized for a quiet pair may be too tight on a volatile one.
Breaks that reverse quickly are covered in false breakouts.
A break shows that the old pace has ended. Price can reverse, move sideways or keep trending at a gentler slope, so treat a break as a reason to look at the chart again.
You can redraw a shallower line through newer swing lows. Do it only when a clear new swing forms, or you end up bending the line to fit every candle.
A broken line sometimes acts from the other side, the same role reversal seen with flat levels. Adding a parallel line on the opposite side of price turns a trend line into a price channel.
أسئلة شائعة
How many points do you need to draw a trend line?
Two points draw the line, and a third reaction is the usual sign that it is confirmed. A line with only two touches can join almost any pair of swings, so treat it as a working guess.
Do you draw trend lines on wicks or bodies?
Either works if you use the same choice for every point on the line. Wicks include brief spikes, and bodies follow opening and closing prices.
What counts as a trend line break?
The usual rule is a candle closing clearly beyond the line, such as the close 15 pips below the uptrend line in the example. A wick that crosses and closes back leaves the line in place.
Does a broken trend line mean the trend has reversed?
Not necessarily. A break shows the old pace has ended, and price can then turn, pause or keep going more slowly.
What angle should a trend line have?
No fixed angle is correct, because the angle you see changes with how the chart is scaled. Very steep lines tend to break sooner than shallow ones.
تابع التعلّم
 الفصل 1What are support and resistance levels?Support is a price area where falling prices have stopped and turned up more than once, because buyers stepped in there. Resistance is the opposite: an area where rises have stalled because sellers took over. Traders use both to plan entries, stops and targets, but any level can break, so none is a guarantee.
 الفصل 1How to draw support and resistance.To draw support and resistance, find swing highs and lows where price turned at about the same price two or more times, then draw a horizontal line through that cluster. Start on the daily or weekly chart for the main levels, refine them on a 4-hour or 1-hour chart, and keep only the nearest few.
 الفصل 1Why support and resistance are zones, not lines.Price rarely turns at one exact number, because orders spread out around a level and price feeds differ slightly between brokers. Treat support and resistance as a zone: a band from the bodies to the wicks of past reactions. Put your stop beyond the far edge, then size the trade so the risk stays fixed.
 الفصل 1When support becomes resistance.When price breaks through a support level, that level often acts as resistance when price returns to it, and broken resistance often turns into support. The return visit is called a retest. Traders watch for a candle that reaches into the old zone and closes back on the break side, though the flip can fail.
 الفصل 1Price channels and how to trade them.A price channel is two parallel lines that contain a trend: a trend line along the swing lows or highs and a copy on the other side. Near the lower edge a buy aims for the upper edge, and the reverse at the top. A close outside either line can mean the channel has ended.
 الفصل 1Trading the bounce or the break.Trading the bounce means buying near support or selling near resistance while the level holds, with a stop just beyond it. Trading the break means entering after price closes through the level, with a stop back inside the old range. Bounce trades fail when the level breaks; break trades fail on false breakouts.
 الفصل 1Support and resistance cheat sheet.Support is a price area where falls have stopped before, and resistance is one where rises have stopped. Mark them as zones from clear swing highs and lows, expect broken levels to swap roles, and plan every bounce or break with a stop beyond the zone. Levels show where to watch, and any of them can break.

