MACD indicator.
MACD, short for moving average convergence divergence, measures the gap between a 12-period and a 26-period exponential moving average of price. A 9-period EMA of that gap forms the signal line, and the histogram shows the difference between the two. It is read as momentum, but it lags price and gives many false signals in ranges.
هذا المحتوى متاح حاليًا باللغة الإنجليزية فقط.
Put two moving averages on a chart and you can see the trend. The distance between them adds something else: whether the move is gathering speed or losing it. MACD plots that distance in its own panel under the price chart.
The name stands for moving average convergence divergence. The indicator has three parts, the MACD line, the signal line and the histogram, and each one is simple arithmetic on past closing prices.
What does the MACD line measure?
Start with two exponential moving averages of the closing price, one over 12 bars and one over 26. An exponential moving average (EMA) gives more weight to recent prices, so the 12 EMA reacts faster.
The MACD line is the 12 EMA minus the 26 EMA. When price rises, the faster average climbs away from the slower one and the MACD line goes up.
When a rise slows down, the gap narrows and MACD starts to fall, even while price is still going up. That is why MACD is read as momentum, the speed of a move.
Say the 12 EMA on a daily EUR/USD chart is 1.10450 and the 26 EMA is 1.10300, both round illustrative numbers. The MACD line is 1.10450 minus 1.10300 = 0.00150.
A pip on EUR/USD is 0.0001, so a MACD of 0.00150 means the two averages are 15 pips apart.
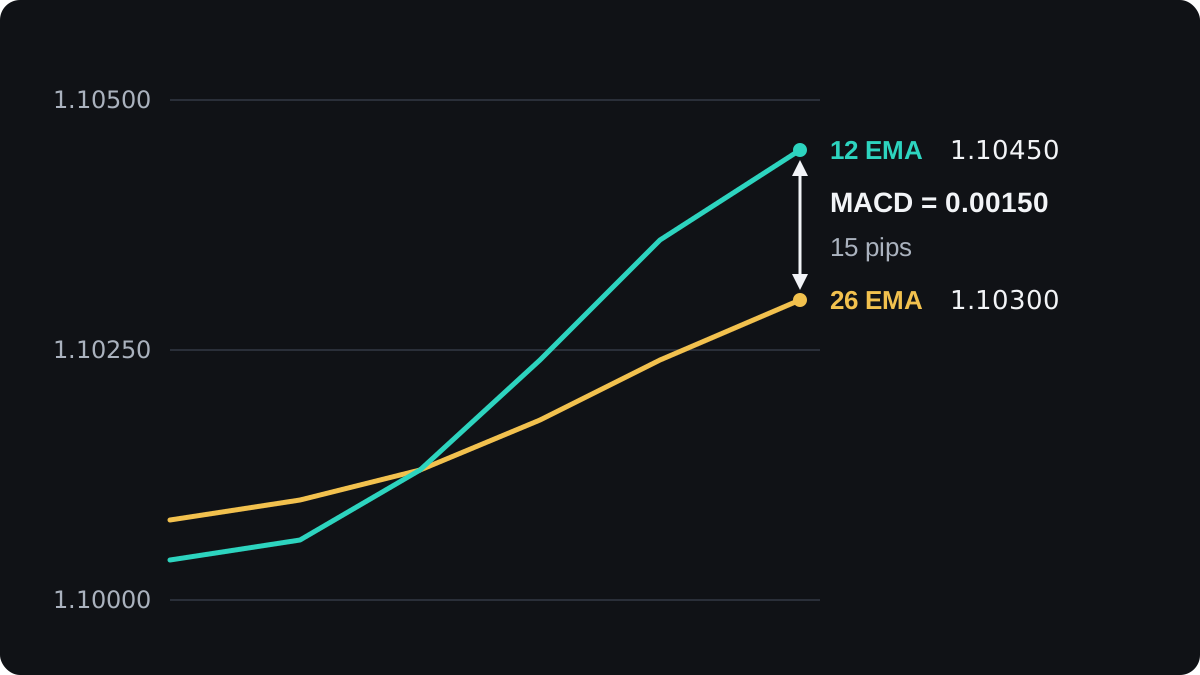
A positive MACD means the fast average is above the slow one, and a negative MACD means it is below. MACD is zero at the moment the two averages cross.
The periods count bars on whatever timeframe you use. On an hourly chart the fast EMA is built from hourly closes, and on a daily chart from daily closes.
How are the signal line and histogram built?
The signal line is a 9-period EMA of the MACD line. It is a smoother, slower copy of MACD, so it trails behind it.
The histogram is the MACD line minus the signal line, drawn as bars around a zero line. Bars above zero mean MACD is above its signal line, and bars below zero mean it is under it.
Here is one new daily bar, using the numbers from above. On the previous bar, MACD was 0.00120 and the signal line was 0.00125.
- MACD on the new bar is 1.10450 minus 1.10300 = 0.00150.
- A 9-period EMA gives the newest value a weight of 2 ÷ (9 + 1) = 0.2.
- New signal = old signal + 0.2 × (MACD minus old signal) = 0.00125 + 0.2 × 0.00025 = 0.00130.
- New histogram = 0.00150 minus 0.00130 = 0.00020, which is 2 pips.
- The previous histogram was 0.00120 minus 0.00125 = -0.00005, which is -0.5 pip.
| Bar | MACD | Signal line | Histogram |
|---|---|---|---|
| Previous | 0.00120 | 0.00125 | -0.00005 |
| New | 0.00150 | 0.00130 | 0.00020 |
The histogram has changed sign, from below zero to above it. That is the same event as the MACD line crossing above its signal line, seen as bars instead of lines.
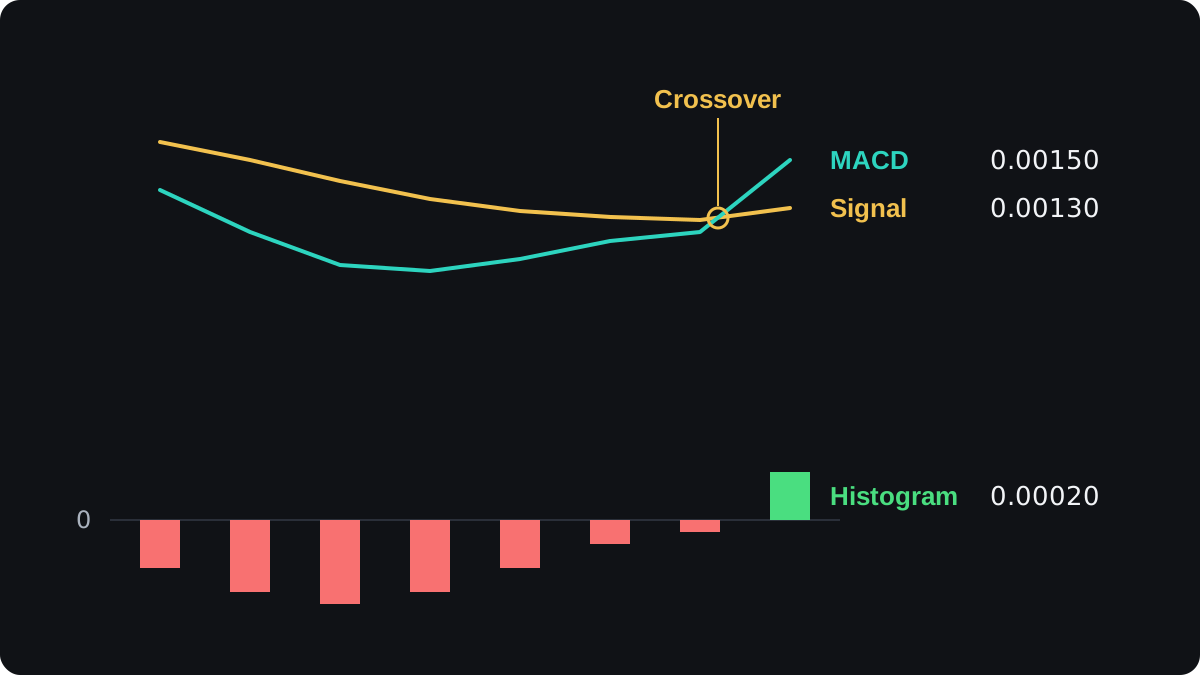
Your platform repeats this sum on every bar. Doing it once by hand shows that each part of MACD comes from past closes and nothing else.
How do you read MACD crossovers and the histogram?
Signal line crossovers
A bullish crossover is MACD moving above its signal line, as in the example. A bearish crossover is MACD moving below it. Both mean momentum has turned relative to its own recent average.
Crossovers are frequent, and many of them happen in the middle of a trend that carries on. A change in the pace of a move can come with no change in its direction.
Zero line crossovers
When MACD crosses zero, the 12 EMA has crossed the 26 EMA on the price chart. This is a moving average crossover shown in another panel, so it appears on exactly the same bar.
You can use the zero line as a filter: look only at buy setups while MACD is above zero, and only at sell setups while it is below.
A shrinking histogram
MACD has to approach its signal line before it can cross it, so the histogram bars usually shrink first. In the chart above they went from -3.5 pips to -0.5 pip over four bars before turning positive.
Shrinking bars mean the move is slowing. Sometimes a crossover follows, and sometimes the bars start growing again in the same direction without one.
What is MACD divergence?
Price and MACD sometimes disagree. Say EUR/USD makes a high at 1.10400, pulls back, then climbs to a higher high at 1.10600. MACD peaks at 0.00120 the first time and only 0.00070 the second.
The second rise reached a higher price with a smaller gap between the averages, so the push behind it was weaker. This mismatch is called bearish divergence.
The mirror image, a lower low in price with a higher low in MACD, is bullish divergence. The divergence lesson covers both types and their variations.
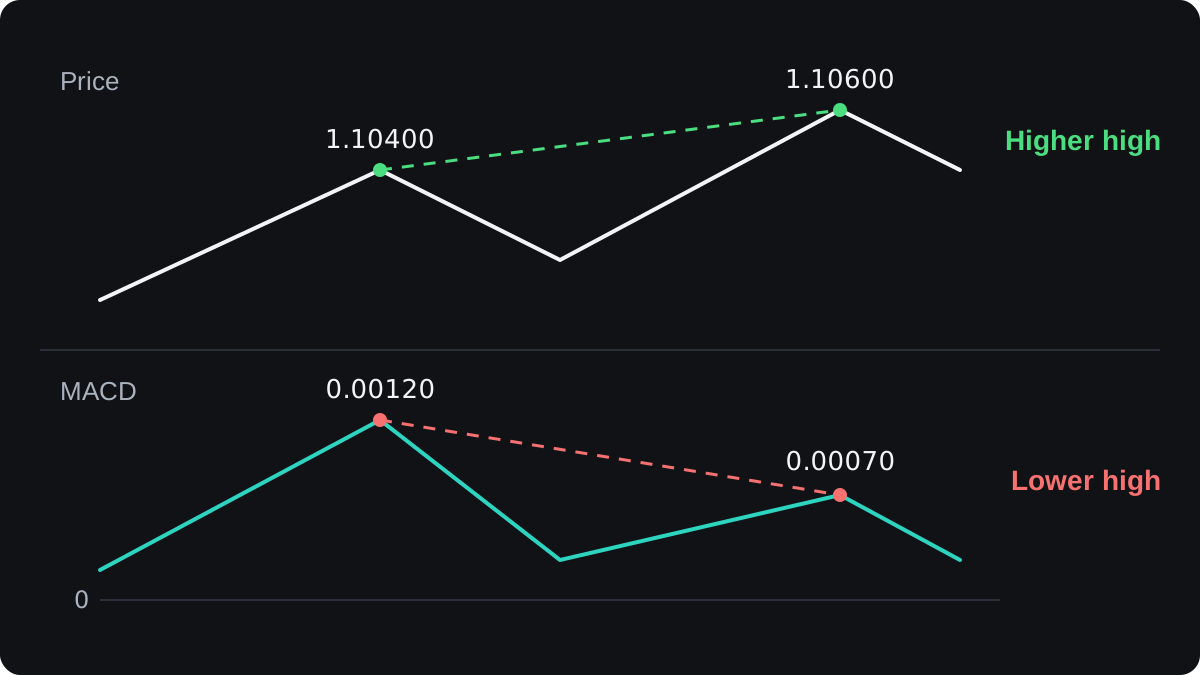
Divergence tells you momentum is fading. It gives no timing, and a trend can carry on through several divergences before it turns.
If you use it, waiting for price to confirm, such as a break below a recent swing low, removes some early signals. The cost is a later entry.
Which MACD settings should you use?
The standard settings are 12, 26 and 9 on closing prices, and most platforms load them by default. They are a convention, with nothing special about the numbers themselves.
Shorter periods make MACD react sooner and give more signals, including more false ones. Longer periods give fewer and later signals. Changing the numbers moves you along that trade-off without removing it.
Check how your platform draws it. MetaTrader's built-in MACD, for example, shows the MACD line as bars and uses a simple average for the signal line, with no separate histogram.
Other charting platforms usually show all three parts, so the same settings can look different from one platform to the next.
MACD is measured in price units, so its size depends on the pair. On USD/JPY, a 12 EMA of 150.40 and a 26 EMA of 150.10 give a MACD of 0.30, which is 30 pips because a yen pip is 0.01.
That reading cannot be compared with 0.00150 on EUR/USD. Compare a pair's MACD only with its own past readings.
Where does MACD fail?
MACD is built from moving averages, so it lags. By the time the 12 EMA has pulled away from the 26 EMA, price has already moved, and a crossover often arrives after a good part of the move is over.
In a sideways market the two averages wind around each other. MACD then hugs zero and crosses its signal line again and again, with little follow-through each time.
The lesson on trending and ranging markets shows how to tell the two conditions apart before you rely on a crossover.
MACD has no fixed ceiling or floor, unlike the RSI, which runs from 0 to 100. A large reading only means a wide gap between the averages, so no level counts as overbought for every pair and timeframe.
The evidence that a plain MACD crossover rule makes money on its own, after costs, is weak and varies with the market and period tested. If you want to try one, backtest it with spreads and commission included, then watch it on a demo account.
MACD and the moving averages under it describe the same thing, so adding another trend-following tool repeats the message. The lesson on combining indicators covers pairing tools that measure different things.
أسئلة شائعة
What does MACD stand for?
Moving average convergence divergence. The name describes two moving averages coming together and moving apart, which is the gap the MACD line measures.
What are the best MACD settings?
No setting is best for every market. The defaults of 12, 26 and 9 are a convention; shorter settings react faster but give more false signals, and longer ones react later.
Is MACD a leading or lagging indicator?
Lagging. It is calculated from moving averages of past closing prices, so its signals come after price has already started to move.
What does it mean when MACD is above zero?
The 12-period EMA is above the 26-period EMA, so the average weighted toward recent closes is higher than the slower one. It says nothing about how long that will last.
How do you read the MACD histogram?
Each bar is the MACD line minus the signal line. Bars growing away from zero mean momentum is building, and bars shrinking toward zero mean it is fading.
تابع التعلّم
 الفصل 5Bollinger Bands.Bollinger Bands are three lines on a price chart: usually a 20-period simple moving average in the middle, with bands two standard deviations above and below it. The bands widen when price moves a lot and narrow when it is quiet. A narrow stretch, called a squeeze, often comes before a larger move in either direction.
 الفصل 5Parabolic SAR.Parabolic SAR is a trend indicator that draws a dot for each bar, below price in an uptrend and above it in a downtrend. The dots move closer to price as the trend extends, and when price crosses them they flip sides. It is often used as a trailing stop, and it gives many false flips in sideways markets.
 الفصل 5Stochastic oscillator.The stochastic oscillator shows where the latest close sits within the high to low range of a set number of candles, on a scale of 0 to 100. Readings above 80 are called overbought and below 20 oversold. They describe recent closes near the top or bottom of the range and do not mean price must reverse.
 الفصل 5Relative Strength Index (RSI).The Relative Strength Index (RSI) is a momentum indicator that compares the size of recent gains with recent losses and plots the result from 0 to 100. The default uses 14 candles. Readings above 70 are called overbought and below 30 oversold, but in a strong trend RSI can stay beyond those lines for a long time.
 الفصل 5Average Directional Index (ADX).The Average Directional Index (ADX) measures how strong a trend is on a scale of 0 to 100, without saying which way it points. Readings above about 25 are commonly read as a trending market and below about 20 as a weak or ranging one. Two companion lines, +DI and −DI, show direction.
 الفصل 5Ichimoku Kinko Hyo.Ichimoku Kinko Hyo is a Japanese trend indicator with five lines: a 9-period conversion line, a 26-period base line, two leading spans that form a cloud 26 periods ahead, and the close plotted 26 periods back. Price above the cloud is read as an uptrend bias, below it as a downtrend bias.
 الفصل 5How to combine indicators.Combine indicators by giving each one a different job. Use one tool to read the trend's direction or strength, and another to time entries, such as a moving average with RSI. Avoid stacking tools that measure the same thing, like RSI and Stochastic together, because they repeat one signal and only look like confirmation.
 الفصل 5Chart indicators cheat sheet.A chart indicator turns past prices into a number or line. Bollinger Bands measure volatility. MACD, Parabolic SAR and Ichimoku follow trend direction. RSI and the stochastic measure momentum, and ADX measures trend strength. Each has a common signal, and each fails in a predictable kind of market, usually trends for oscillators and ranges for trend tools.

