Stochastic oscillator.
The stochastic oscillator shows where the latest close sits within the high to low range of a set number of candles, on a scale of 0 to 100. Readings above 80 are called overbought and below 20 oversold. They describe recent closes near the top or bottom of the range and do not mean price must reverse.
هذا المحتوى متاح حاليًا باللغة الإنجليزية فقط.
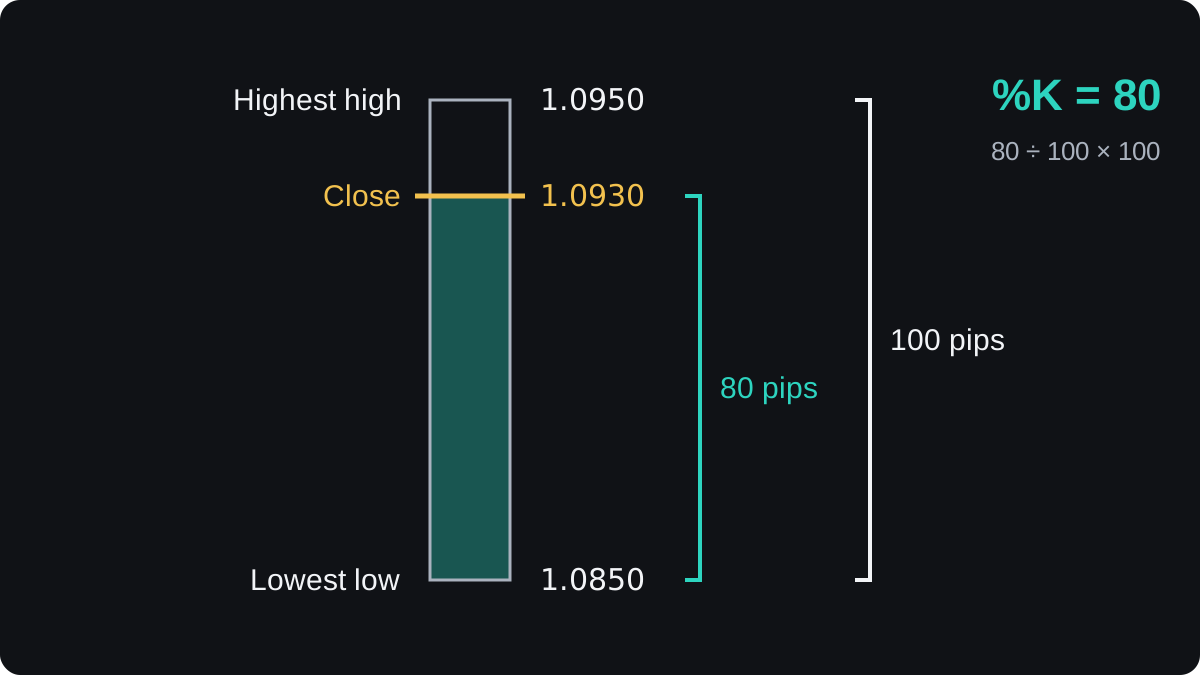
Say EUR/USD has traded between 1.0850 and 1.0950 over the last 14 candles, and the latest candle closes at 1.0930. That close sits near the top of the recent range.
The stochastic oscillator turns that position into a number from 0 to 100. Here the number is 80. All prices in this lesson are round illustrative figures.
What does the stochastic oscillator measure?
The stochastic oscillator is a momentum indicator that compares the latest close with the highest high and the lowest low of a set number of candles, called the lookback period. Charts draw it in a panel below price.
It belongs to the family of oscillators, indicators that swing back and forth rather than follow price. The stochastic has fixed limits: a reading can never fall below 0 or rise above 100, on any pair or timeframe.
A close at the very top of the range gives 100. A close at the very bottom gives 0. A close exactly halfway gives 50.
The idea behind it is a habit of markets. In a rising market, closes tend to land near the top of the recent range, and in a falling market near the bottom. When closes stop doing that, the pressure may be fading.
How do you calculate %K and %D?
The main line is %K. Its formula is:
%K = (close − lowest low) ÷ (highest high − lowest low) × 100
Take the EUR/USD example with a 14-candle lookback:
- The highest high of the last 14 candles is 1.0950.
- The lowest low of those candles is 1.0850.
- The range is 1.0950 − 1.0850 = 0.0100, which is 100 pips.
- The close sits 1.0930 − 1.0850 = 0.0080 above the low, which is 80 pips.
- %K = 0.0080 ÷ 0.0100 × 100 = 80.
The second line, %D, is a simple moving average of %K, usually over 3 periods. It moves more slowly than %K and is read as the signal line.
Suppose the last three %K readings were 72, 75 and 81. Then %D = (72 + 75 + 81) ÷ 3 = 228 ÷ 3 = 76.
A yen pair uses the same sum, with 0.01 as the pip. Say USD/JPY's 14-candle high is 151.00, its low 149.00 and its close 149.30.
The range is 2.00, or 200 pips. The close sits 0.30, or 30 pips, above the low. So %K = 0.30 ÷ 2.00 × 100 = 15.
| Pair | Highest high | Lowest low | Close | Close above low | Range | %K |
|---|---|---|---|---|---|---|
| EUR/USD | 1.0950 | 1.0850 | 1.0930 | 80 pips | 100 pips | 80 |
| USD/JPY | 151.00 | 149.00 | 149.30 | 30 pips | 200 pips | 15 |
Only the close's position inside the range counts, so a quiet pair and a volatile pair can show the same reading.
What are the fast, slow and full versions?
Raw %K jumps around because one new candle can change the high, the low and the close at the same time. Platforms offer smoothed versions to calm it down.
- The fast stochastic plots raw %K, with %D as its 3-period average.
- The slow stochastic takes that %D as its new %K, then averages it again over 3 periods for its own %D.
- The full stochastic lets you choose all three numbers yourself.
A setting written 14, 3, 3 means a 14-candle lookback, %K smoothed over 3 periods, and %D averaged over 3 more. That full stochastic matches the slow version, and it is a common starting point.
MetaTrader names the %K smoothing field Slowing. Defaults differ between platforms, so check the settings window before you compare two charts.
A shorter lookback reacts faster and produces more signals, many of them noise. A longer lookback is calmer and slower to turn.
What do overbought and oversold mean?
Most stochastic panels show two guide lines, at 80 and 20. A reading above 80 is called overbought, and a reading below 20 is called oversold.
Both words describe where recent closes sat. Overbought means near the top of the recent range. It makes no claim that price is too high or due to fall.
The textbook signals are crossovers between the two lines:
- %K crossing below %D while both are above 80, read as upward momentum turning down.
- %K crossing above %D while both are below 20, read as downward momentum turning up.
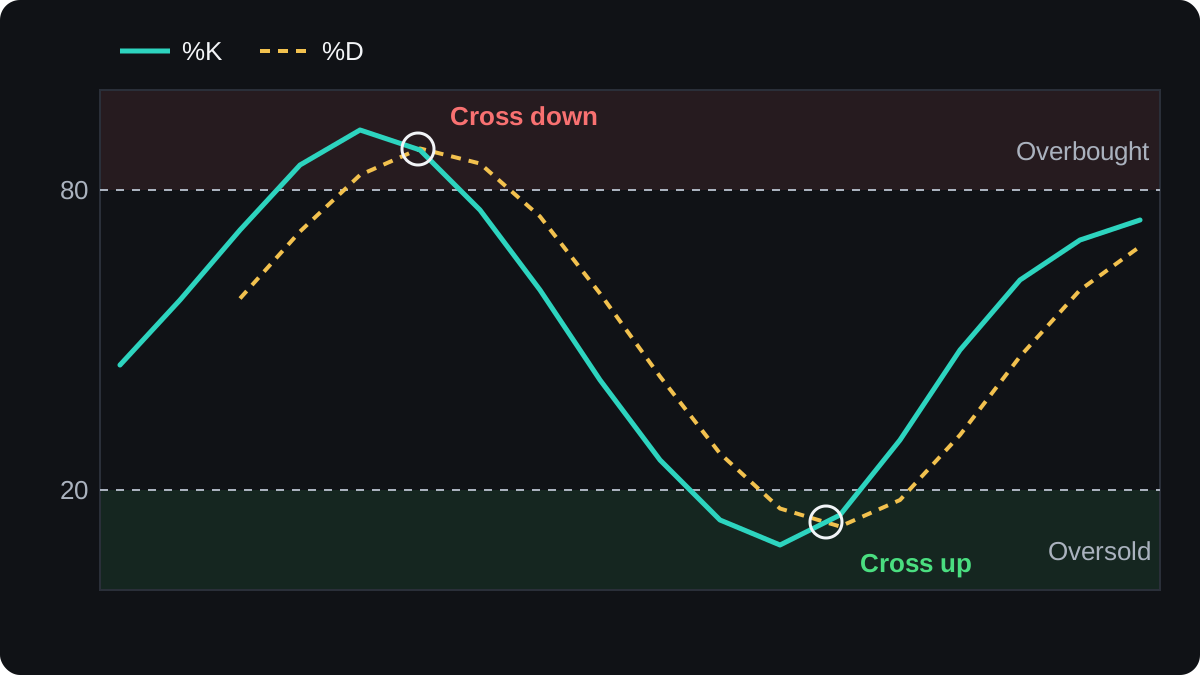
A stricter version of the rule waits until the line leaves the zone, such as %K dropping back below 80. That filters some false signals and makes the rest arrive later.
The stochastic is also compared with price. If price makes a higher high while the stochastic makes a lower high, the mismatch is called divergence.
It hints that the push may be weakening, and it can last a long time before price turns, if it turns at all.
Where does the stochastic oscillator fail?
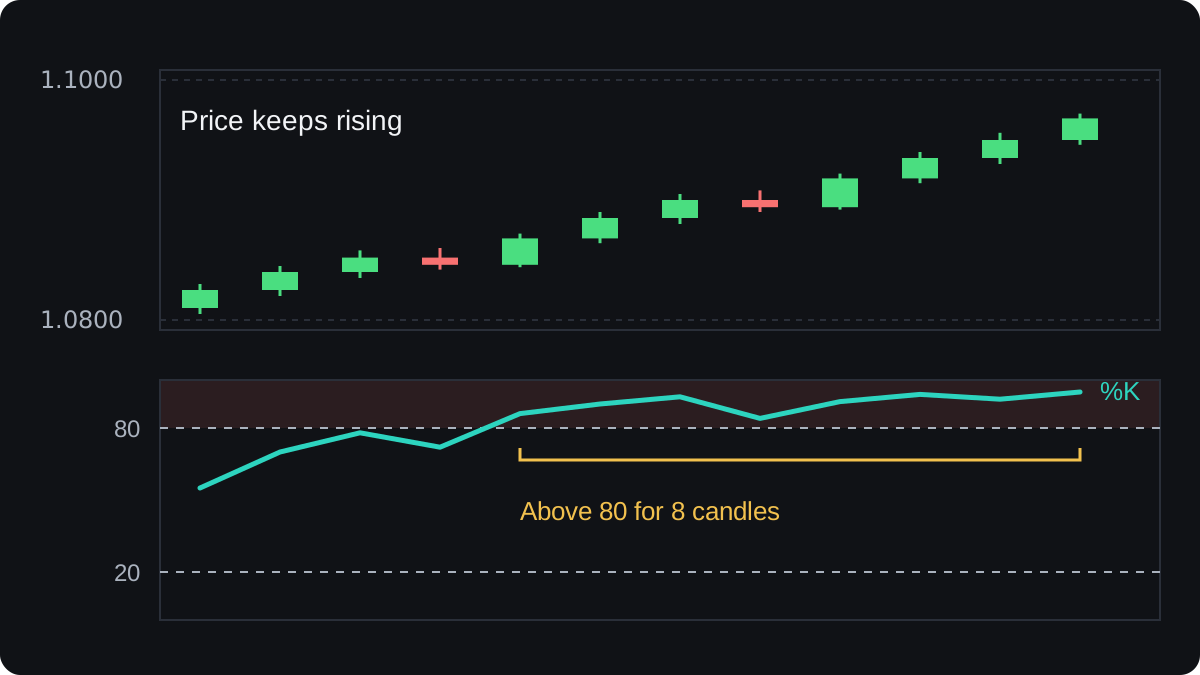
In a strong trend the stochastic can stay above 80, or below 20, for a long run of candles. Selling each overbought reading in an uptrend means selling again and again into a market that keeps rising.
The chart below is illustrative. EUR/USD climbs toward 1.1000 while %K stays above 80 for the last 8 candles.
Overbought and oversold readings are usually taught as more useful when price moves sideways. The lesson on trending and ranging markets shows how to tell the two apart.
The ADX, later in this module, measures how strong a trend is, which helps you judge whether an overbought reading means much.
The indicator lags too. In the slow version, %D is an average of an average, so a crossover usually shows up after a turn has already started.
Fast markets cause whipsaws, where the lines cross back and forth around 80 or 20 and every cross looks like a signal. A shorter lookback makes this worse.
The evidence that the basic 80 and 20 rules make money on their own, after spread and commission, is weak.
Treat any setting as an idea to test, first with backtesting and then on a demo account, before real money is involved.
The next lesson, the RSI, is another 0 to 100 oscillator. It is built from the average size of up and down moves between closes, where the stochastic uses the high to low range.
أسئلة شائعة
What are the best settings for the stochastic oscillator?
No setting is best for every pair and timeframe. 14, 3, 3 is a common starting point, and a shorter lookback gives more signals with more noise.
What does a stochastic reading of 80 mean?
On raw %K, the close sits 80% of the way from the lowest low to the highest high of the lookback period. It describes where price closed and does not predict a fall.
What is the difference between %K and %D?
%K is the main line, the close's position in the recent range. %D is a moving average of %K, usually over 3 periods, and is the slower signal line.
Is the stochastic oscillator better than RSI?
Neither is better in general. Both are momentum oscillators from 0 to 100, and both can stay overbought or oversold during a strong trend.
Can you use the stochastic on any timeframe?
Yes, the formula works on any candle length. Shorter timeframes give more signals, more noise and moves that are small next to the spread.
تابع التعلّم
 الفصل 5Bollinger Bands.Bollinger Bands are three lines on a price chart: usually a 20-period simple moving average in the middle, with bands two standard deviations above and below it. The bands widen when price moves a lot and narrow when it is quiet. A narrow stretch, called a squeeze, often comes before a larger move in either direction.
 الفصل 5MACD indicator.MACD, short for moving average convergence divergence, measures the gap between a 12-period and a 26-period exponential moving average of price. A 9-period EMA of that gap forms the signal line, and the histogram shows the difference between the two. It is read as momentum, but it lags price and gives many false signals in ranges.
 الفصل 5Parabolic SAR.Parabolic SAR is a trend indicator that draws a dot for each bar, below price in an uptrend and above it in a downtrend. The dots move closer to price as the trend extends, and when price crosses them they flip sides. It is often used as a trailing stop, and it gives many false flips in sideways markets.
 الفصل 5Relative Strength Index (RSI).The Relative Strength Index (RSI) is a momentum indicator that compares the size of recent gains with recent losses and plots the result from 0 to 100. The default uses 14 candles. Readings above 70 are called overbought and below 30 oversold, but in a strong trend RSI can stay beyond those lines for a long time.
 الفصل 5Average Directional Index (ADX).The Average Directional Index (ADX) measures how strong a trend is on a scale of 0 to 100, without saying which way it points. Readings above about 25 are commonly read as a trending market and below about 20 as a weak or ranging one. Two companion lines, +DI and −DI, show direction.
 الفصل 5Ichimoku Kinko Hyo.Ichimoku Kinko Hyo is a Japanese trend indicator with five lines: a 9-period conversion line, a 26-period base line, two leading spans that form a cloud 26 periods ahead, and the close plotted 26 periods back. Price above the cloud is read as an uptrend bias, below it as a downtrend bias.
 الفصل 5How to combine indicators.Combine indicators by giving each one a different job. Use one tool to read the trend's direction or strength, and another to time entries, such as a moving average with RSI. Avoid stacking tools that measure the same thing, like RSI and Stochastic together, because they repeat one signal and only look like confirmation.
 الفصل 5Chart indicators cheat sheet.A chart indicator turns past prices into a number or line. Bollinger Bands measure volatility. MACD, Parabolic SAR and Ichimoku follow trend direction. RSI and the stochastic measure momentum, and ADX measures trend strength. Each has a common signal, and each fails in a predictable kind of market, usually trends for oscillators and ranges for trend tools.

