Reviewing your trades.
A trade review is a fixed weekly check of your journal. You grade each trade on whether it followed your plan, measure results in R, the multiple of planned risk, tag every rule break, and count the tags over several weeks to find the mistake you repeat most, then fix one rule at a time.
هذا المحتوى متاح حاليًا باللغة الإنجليزية فقط.

A journal only pays off when you read it back. Once a week you open the entries, separate the trades you planned from the ones you improvised, and look for the error that keeps coming back.
This lesson builds that routine and runs it on one illustrative week of ten trades. It assumes you already log the details from what to record in a trading journal.
What is a trade review looking for?
Take two trades. In the first you followed every rule and hit your stop. In the second you entered on a hunch, doubled your size and made money.
A review that only counts money rates the second trade higher. Repeat that for a few months and you reward the habit most likely to cause a large loss later.
So the review grades two things separately. The outcome is what the trade made or lost. The process is whether you did what your plan said at entry, during the trade and at exit.
Any single outcome can go either way by chance. Process is under your control, which is why you check it first.
How do you measure results in R?
Dollar results are hard to compare when your position size changes from trade to trade. The fix is to measure each trade against the amount you planned to risk on it.
An R multiple is a trade's result divided by that planned risk. If you planned to lose $50 at your stop and the trade made $100, it was +2R. A trade closed at the planned stop is -1R.
Record results net of spread, commission and swap, so R reflects what reached your account. The cost of one trade lesson shows how to add those up.
Costs can push a stop-out slightly below -1R. A loss well beyond -1R needs a closer look: usually the stop was moved, or the price gapped or slipped past it.
The average R per trade is called expectancy. It says what the average trade earned in units of risk, and it connects to risk-reward ratio and win rate.
A weekly review in five steps
Pick a fixed time when markets are closed, such as the weekend, and set aside 30 to 60 minutes. Reviewing at the same point each week keeps the numbers comparable.
- Collect. Open every trade from the week with its screenshot and notes.
- Grade the process. For each trade, answer yes or no: did it follow the plan for entry, size, stop and exit?
- Tag each rule break with a short fixed label, such as moved stop or early entry. Use the same words every week so they can be counted.
- Count. Add up the R for plan trades and for rule-break trades separately, then tally the tags.
- Change. Choose one rule for next week and write it at the top of the next journal page.
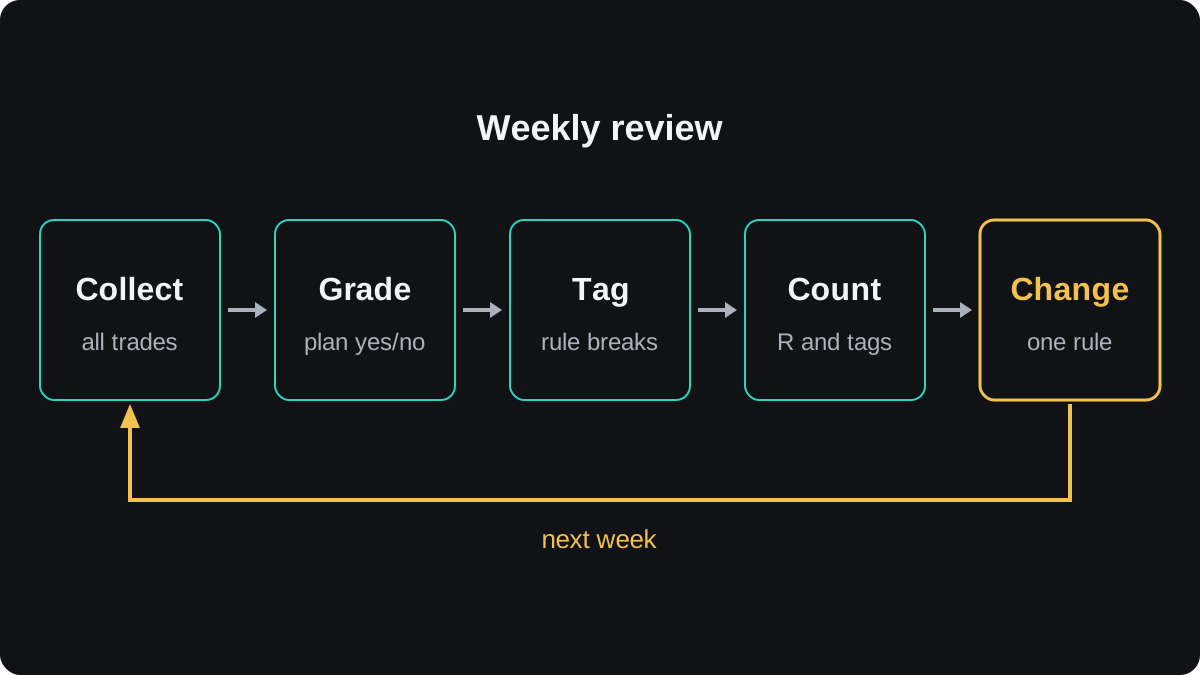
Step 5 is the easiest to skip. Without it the review becomes a report you read once and forget.
Worked example: one week of ten trades
Here is an illustrative week. You risk $50 on every trade, so 1R = $50. To keep the sums simple, each stop-out counts as exactly -1.0R.
Six trades followed the plan and four broke a rule.
| Trade | Result | Followed plan | Tag |
|---|---|---|---|
| 1 | +2.0R | Yes | None |
| 2 | -1.0R | Yes | None |
| 3 | -1.0R | Yes | None |
| 4 | +1.5R | Yes | None |
| 5 | -1.6R | No | Moved stop |
| 6 | -1.0R | No | Early entry |
| 7 | +0.5R | No | Closed early |
| 8 | -1.0R | Yes | None |
| 9 | -1.4R | No | Moved stop |
| 10 | +2.0R | Yes | None |
- Week total: 2.0 - 1.0 - 1.0 + 1.5 - 1.6 - 1.0 + 0.5 - 1.0 - 1.4 + 2.0 = -1.0R, which is -1.0 × $50 = -$50.
- Plan trades (1, 2, 3, 4, 8 and 10): 2.0 - 1.0 - 1.0 + 1.5 - 1.0 + 2.0 = +2.5R, or +$125.
- Rule-break trades (5, 6, 7 and 9): -1.6 - 1.0 + 0.5 - 1.4 = -3.5R, or -$175.
- Check: +2.5R - 3.5R = -1.0R, the same as step 1.
- Expectancy: plan trades +2.5 ÷ 6 = +0.42R per trade, rule breaks -3.5 ÷ 4 = -0.875R per trade.
The week lost $50 while the plan trades made $125. The two moved stops, trades 5 and 9, lost 0.6R + 0.4R = 1.0R more than the plan allowed.
Had both stops stayed in place, those trades would have closed at -1.0R each. The week would then have finished at -1.0R + 1.0R = 0R, break-even.
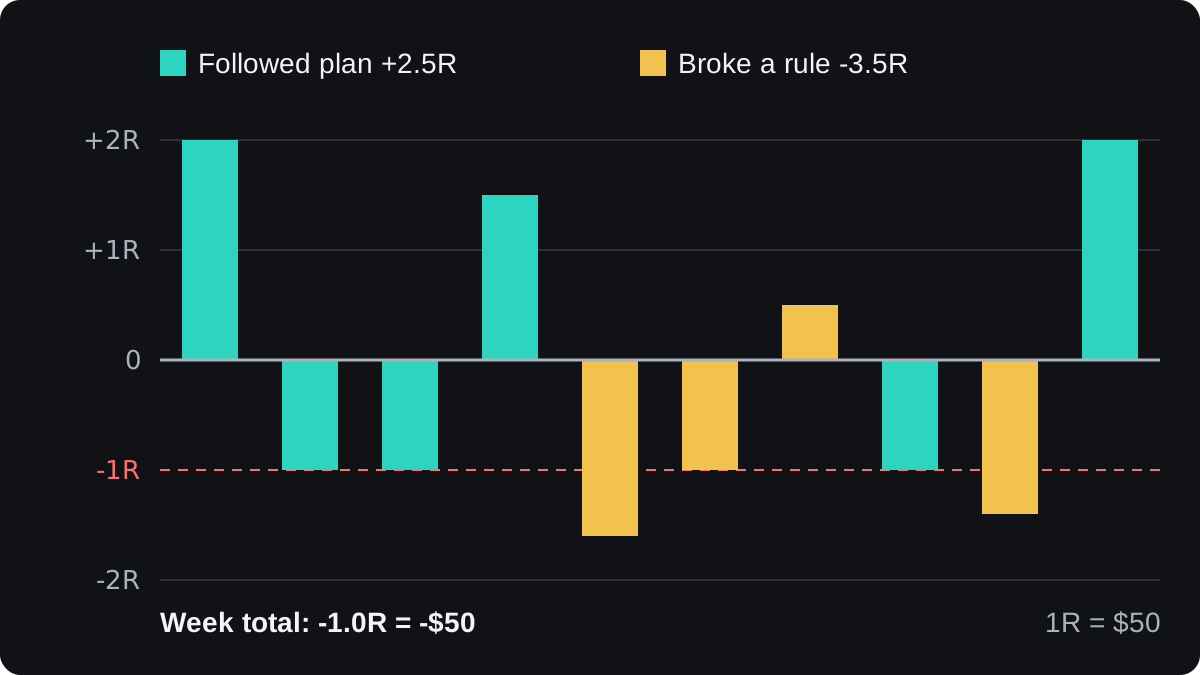
Trade 7 shows why winners get graded too. It made +0.5R, yet closing before the target was a rule break, so it carries a tag like any other.
Why ten trades prove very little
With so few trades, one result swings the win rate a long way. The plan trades above won 3 of 6, or 50%, and one different outcome would make it 33% or 67%.
So a weekly review judges process, which you can check trade by trade. Judging whether the strategy has an edge needs many more trades taken under the same rules.
A practical split is weekly for rule breaks, and monthly or quarterly for results such as expectancy and drawdown. The drawdown calculator helps with the longer view.
Avoid rewriting the strategy after one bad week. If plan trades keep losing over a large sample, test any change first, as in forward testing on a demo account.
How do you find and fix the mistakes you repeat?
One week rarely shows a pattern. Keep the tags running and add them up every four weeks.
Suppose four weeks of tags read: moved stop 7, early entry 3, closed early 2, position too large 1. The week above supplied two of those seven moved stops.
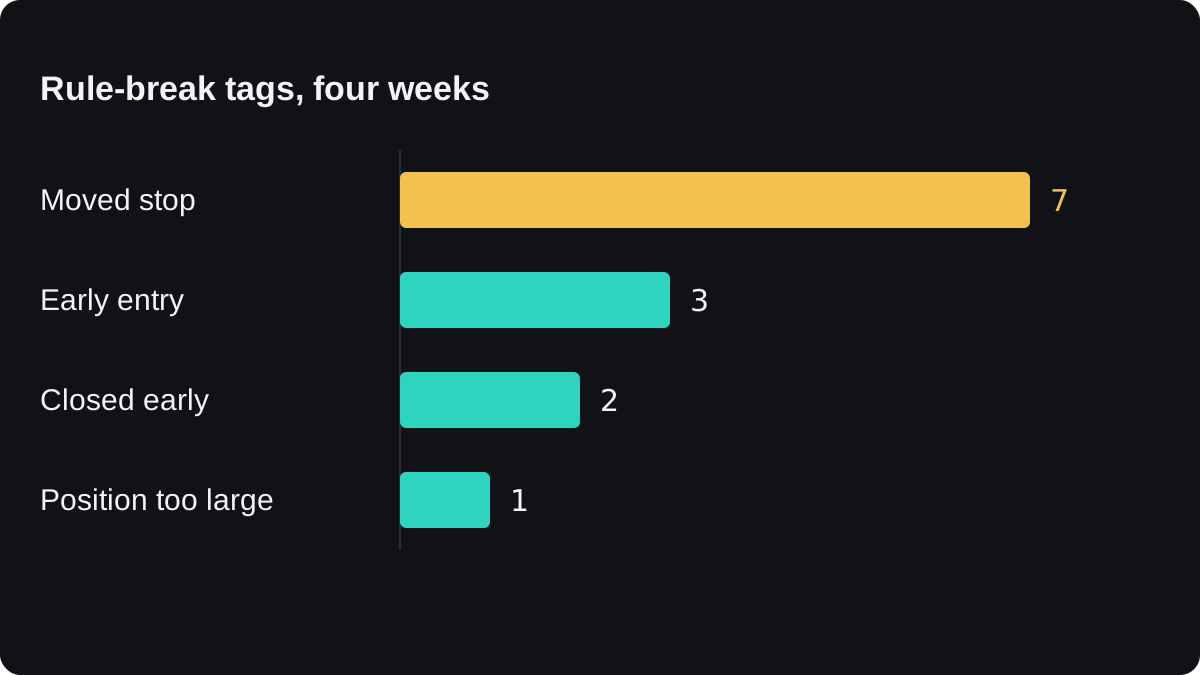
Start with the longest bar. A mistake you make seven times a month costs more than one you make once, so fixing it first changes your results the most.
Then ask when it happens. Filter the tagged trades by time of day, by pair, or by what happened on the trade before.
A moved stop that comes right after a loss may point to frustration, a topic in trading psychology basics. Screenshots help here, because the chart at entry shows whether the setup really matched your rules.
Turning the habit into a rule for next week
Write the change as a rule you can grade with yes or no. A rule such as _be more patient_ cannot be graded. _Once the stop is set, it only moves towards profit_ can be checked on every trade.
Next week, step 2 of the review includes that rule. If the count of moved stop tags falls, keep the rule. If it does not, look at the conditions around each break.
Add only one new rule at a time, so you can tell which change made the difference. Sticking to your plan has ways to make rules easier to follow.
Many of the tags you will find, such as moved stops and oversized trades, are failures of risk control. The next lesson, what risk management is, deals with them directly.
أسئلة شائعة
How often should I review my trades?
Weekly works well for checking rule breaks, because the trades are fresh in your memory. Judge results such as win rate and expectancy over longer periods with more trades.
What is a good expectancy?
An expectancy above zero after costs means the average trade made money in that sample. The fewer trades in the sample, the less the number tells you about the future.
Should I review winning trades too?
Yes. A winning trade that broke a rule is still a rule break, and in the example above trade 7 made +0.5R while closing early.
What if I keep breaking the same rule?
Look at what surrounds each break, such as the time of day or a loss just before. You can also add a rule that ends your trading day after a break, so one mistake does not turn into several.
Can I review trades without a journal?
Your platform history gives prices and results, but it does not record your reasons or whether you followed the plan. Without those notes you can only review outcomes.
تابع التعلّم
 الفصل 4Why keep a trading journal?A trading journal is a written record of every trade, with the reason, the plan and your state of mind next to the price and result. It turns wins and losses into data you can sort, showing which habits make money and which lose it, something your account balance alone cannot show.
 الفصل 4What to record in a trading journal.A trading journal entry should record why you took the trade, the pair, direction, entry, stop and target, the size and money at risk, the exit and why, every cost, and the net result as a multiple of your risk. Add whether you followed your plan and how you felt, so you can tell good decisions from lucky ones.

