What to record in a trading journal.
A trading journal entry should record why you took the trade, the pair, direction, entry, stop and target, the size and money at risk, the exit and why, every cost, and the net result as a multiple of your risk. Add whether you followed your plan and how you felt, so you can tell good decisions from lucky ones.

A useful journal entry lets you rebuild a trade weeks later. It shows why you took it, how big it was, what it cost and what was going on in your head at the time.
The previous lesson covered why a journal helps. This one lists the fields to fill in and works through one complete entry with numbers.
What to write before you open the trade
Fill in the first half of the entry before you click. A reason written afterwards tends to drift toward whatever the market actually did.
Start with the basics: date and time, pair, direction (long or short) and the chart timeframe you used. Add the trading session and any scheduled news nearby, because prices can jump and spreads can widen around big data releases.
Then write the setup in one or two plain sentences. A line such as 'bounce from support at 1.10400 on the 1 hour chart, trend up on the 4 hour' is useful later. A line such as 'looked good' is useless.
Last, write the plan: entry price, stop loss, take profit, and anything that would make you close early. If you cannot fill in the stop, the trade has no defined risk yet.
How to record size and risk in numbers
Write the size in lots and the risk in money. The money figure is what lets you compare a small trade with a large one when you review.
Here is an illustrative example. Your account holds $5,000, you risk 1% per trade as an example figure, and you plan to buy EUR/USD at an ask of 1.10400 with a stop at 1.10200 and a target at 1.10800.
- Money at risk: 1% of $5,000 = $50.
- Stop distance: 1.10400 − 1.10200 = 0.00200, which is 20 pips.
- One standard lot of EUR/USD is worth $10 per pip, so 20 pips on one lot is $200.
- Size: $50 ÷ $200 = 0.25 lot, so each pip is worth $2.50.
- Target distance: 1.10800 − 1.10400 = 40 pips, and 40 × $2.50 = $100, twice the risk.
Record all five numbers in the entry. The lot size calculator does step 4 for other pairs, and the lesson on risk per trade discusses how people choose the percentage.
What to write after the trade closes
Record the exit price, the exit time and why you left: stop hit, target hit or a manual close. For a manual close, write the reason in your own words while you still remember it.
In the example, price first dipped to 1.10300, 10 pips against you, a floating loss of 10 × $2.50 = $25. It then rose to 1.10750, pulled back 10 pips, and you got nervous and sold at a bid of 1.10650.
The move was 1.10650 − 1.10400 = 0.00250, or 25 pips. At $2.50 per pip the gross profit is 25 × $2.50 = $62.50.
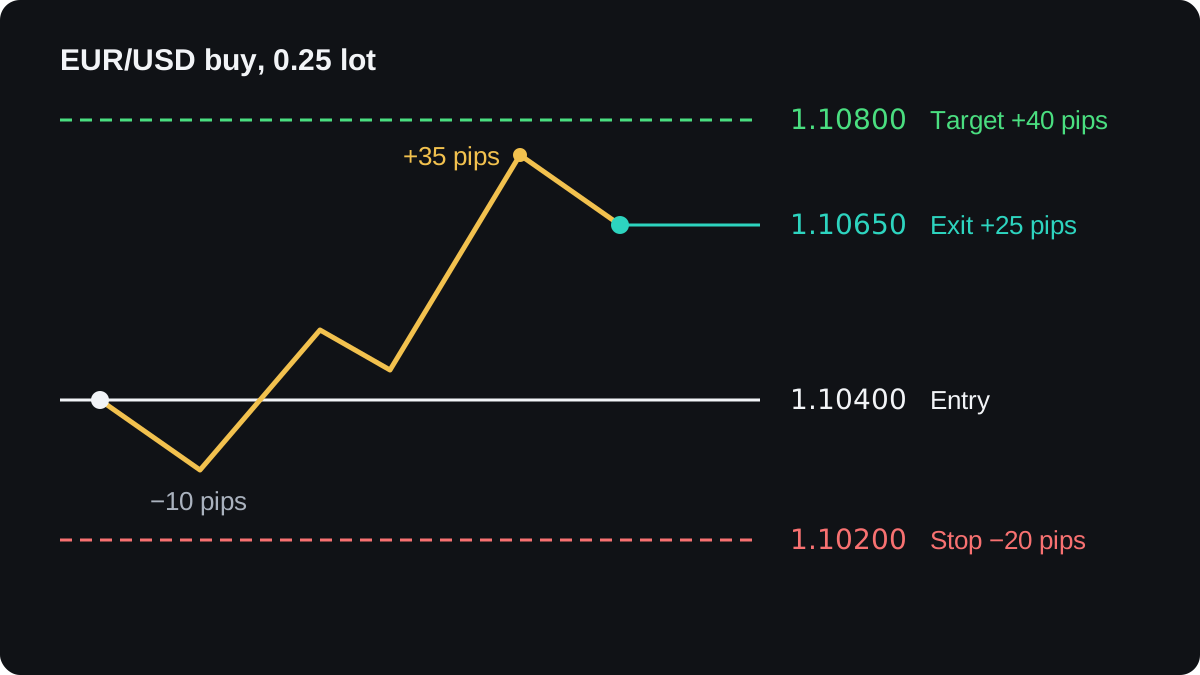
Also note the furthest price went against you while the trade was open, called the maximum adverse excursion, and the furthest it went in your favour, the maximum favourable excursion. Here they are 10 pips and 35 pips.
This trade reached +35 pips and you kept 25. Over many trades, these two numbers can suggest whether your stops sit too close or you tend to leave too early. One trade on its own tells you very little.
Finally, turn the result into an R multiple: the net result divided by the money you planned to risk. A full stop loss is about −1R, and this trade's target would have been +2R. The risk-reward lesson builds on this idea.
Which costs belong in each entry
The $62.50 is the price move only. Your balance changes by the net figure, so give each cost its own line and you will see which one grows over time.
- Spread: already inside your fill prices, because you bought at the ask and sold at the bid. You can note the spread at entry, but do not subtract it a second time.
- Commission: charged per lot on some account types, as the commission per lot lesson explains. With an illustrative $7 per lot round trip, 0.25 × $7 = $1.75.
- Swap: the trade was held overnight, so a swap was applied. Say it was a charge of $0.60, an illustrative figure.
- Slippage: the gap between the price you expected and the price you got. Write it in pips whenever it happens, even when it is zero.
The net result is $62.50 − $1.75 − $0.60 = $60.15. In R that is $60.15 ÷ $50 = 1.20R, against the 2R you planned.
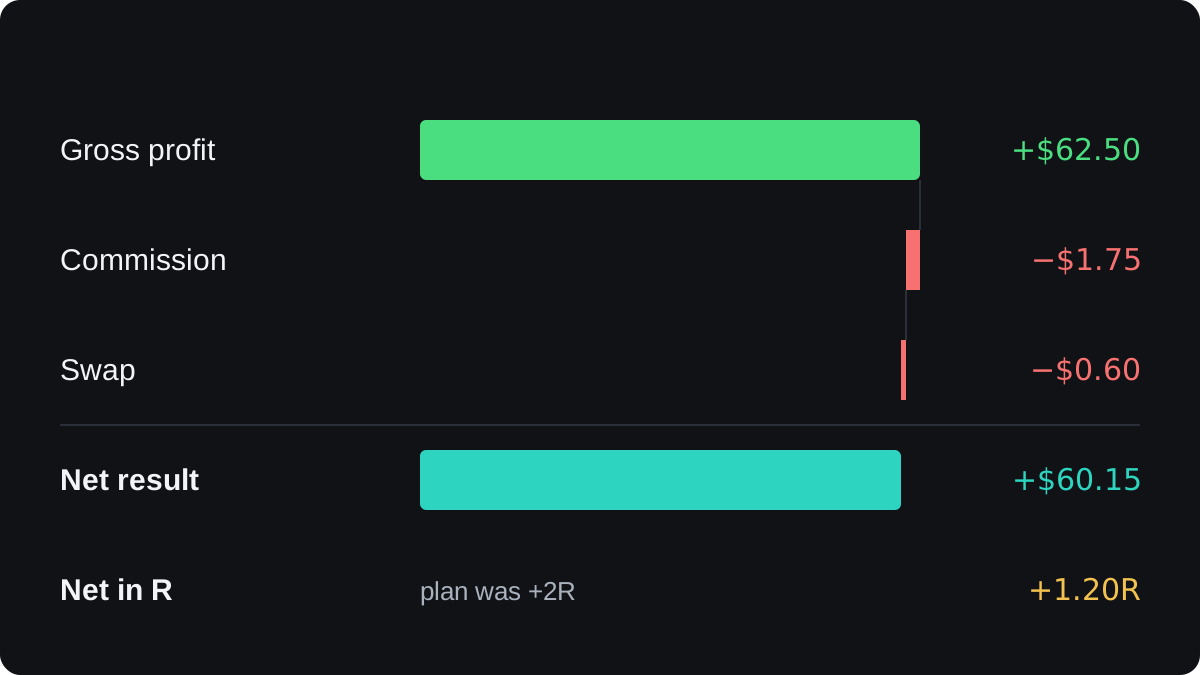
Copy commission and swap from your platform's account history rather than estimating them. A full stop loss on this trade would also have paid these fees, so it would have come out slightly worse than −1R.
Why your feelings and rule checks belong in the journal
Two trades with the same profit can come from opposite behaviour. One followed the plan, and the other broke it and got lucky. Only your notes can tell them apart.
Add a few short fields. Did you follow your plan, yes or no? How did you feel before entry and before exit, in one word each, such as calm, rushed or bored?
Then give the trade a score from 1 to 5 for how well you carried out the plan. Judge the process, whatever the profit was.
In the example, the entry followed the plan and the exit did not. A note might read: 'Closed at +25 pips because a 10 pip pullback from +35 scared me. Plan said hold to 1.10800 or the stop.'
That note tells you more than the $60.15 does, because it names a habit you can count across your next trades. Give it a short tag, such as 'early exit' or 'moved stop', so it is easy to tally later.
The lesson on trading psychology basics describes the reactions that most often show up in these notes.
How to keep the journal short enough to keep using
A journal you abandon after two weeks records nothing. Aim for an entry you can finish in a few minutes, using a fixed template that is mostly numbers and short tags.
A spreadsheet with one row per trade is enough, and so is a paper notebook. Add a screenshot of the chart at entry and at exit with your levels marked, because the picture keeps context the numbers lose.
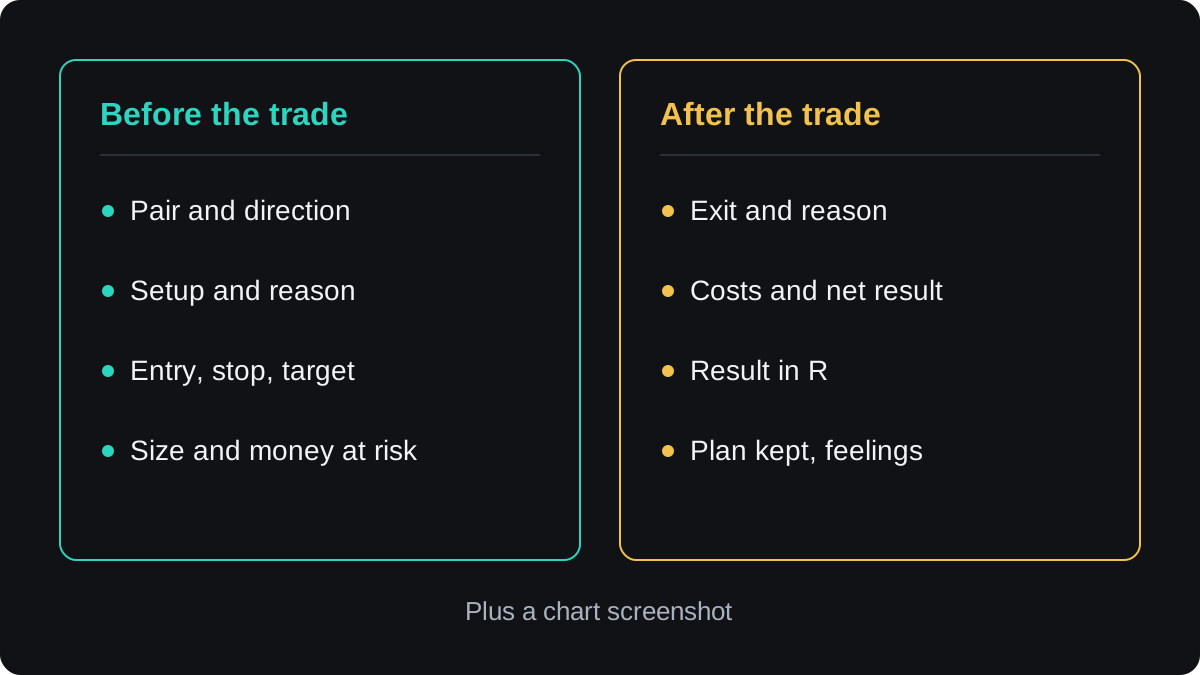
Log every trade, including the small ones and the ones you would rather forget. A journal with the bad trades left out makes your results look better than they are.
Once you have a few dozen entries, the next lesson shows how to read them for patterns.
Questions
What is the most important thing to record in a trading journal?
The money you planned to risk, the net result in R and whether you followed your plan. Without the risk you cannot compare trades, and without the rule check you cannot tell a good decision from a lucky one.
Should I record demo trades in my journal?
Yes, but keep them in a separate log or tag them clearly. Fills and emotions on a demo account can differ from live trading, so the two sets of numbers should not be mixed.
Do I need special software for a trading journal?
No. A spreadsheet or notebook covers every field in this lesson. Software can import prices and costs for you, but you still have to write the reason and the feelings yourself.
How do I calculate R for a trade?
Divide the net result by the money you planned to risk. A $60.15 net gain on $50 of planned risk is 1.20R, and a full stop loss is about −1R before costs.
How much detail is too much?
If filling in an entry takes longer than making the trade decision, cut fields. Keep the ones you actually look at when you review.
Keep learning
 Chapter 4Why keep a trading journal?A trading journal is a written record of every trade, with the reason, the plan and your state of mind next to the price and result. It turns wins and losses into data you can sort, showing which habits make money and which lose it, something your account balance alone cannot show.
 Chapter 4Reviewing your trades.A trade review is a fixed weekly check of your journal. You grade each trade on whether it followed your plan, measure results in R, the multiple of planned risk, tag every rule break, and count the tags over several weeks to find the mistake you repeat most, then fix one rule at a time.

