What is divergence?
Divergence is when price and an indicator disagree. Price makes a new high or low, but an oscillator such as RSI or MACD does not make a matching one. It warns that the move is losing speed. It does not say when, or whether, price will turn, and it can last a long time.
هذا المحتوى متاح حاليًا باللغة الإنجليزية فقط.

Picture EUR/USD climbing to 1.10200, pulling back, then pushing on to 1.10500. The chart looks strong. Underneath it, the RSI read 72 at the first high and only 64 at the second.
Price made a higher high while the indicator made a lower high. Divergence is that kind of disagreement: price makes a new high or low, and an indicator calculated from the same price does not make a matching one.
What does divergence look like on a chart?
You need a price chart and an oscillator drawn below it, such as the Relative Strength Index (RSI). Then you compare two peaks, or two troughs, in both panels.
In the opening example the price peaks are 1.10200 and 1.10500, a rise of 30 pips. The RSI peaks at the same moments are 72 and 64, a fall of 8 points.
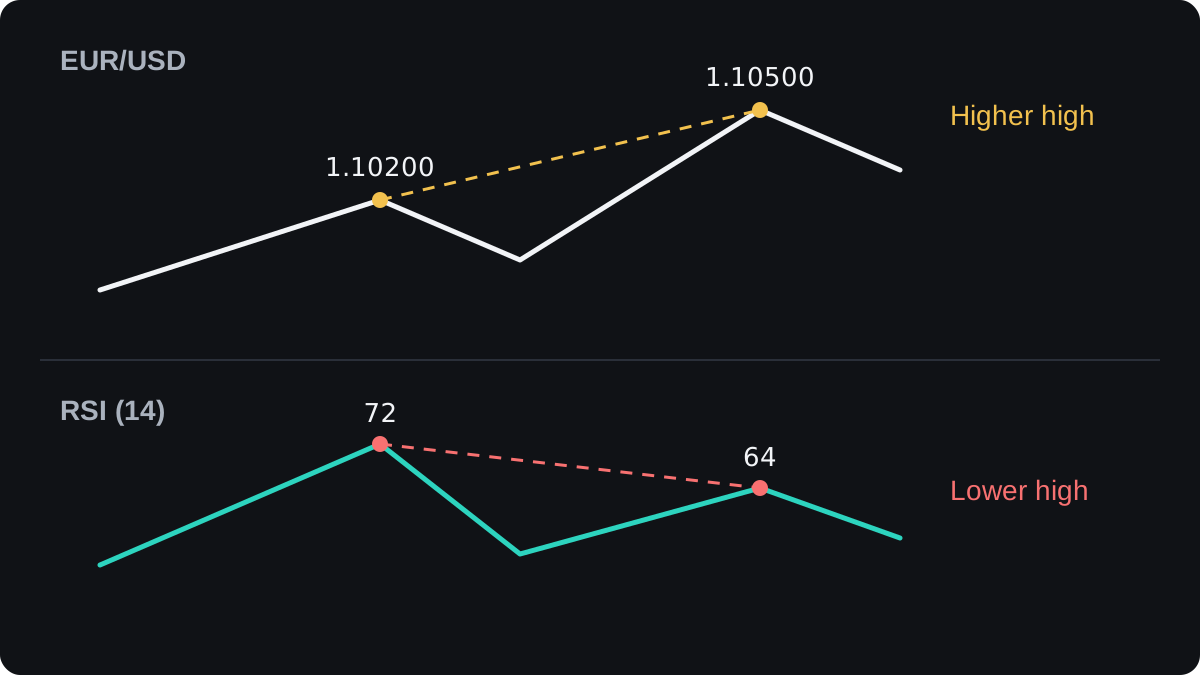
A higher high in price with a lower high in the indicator is bearish divergence, because it hints that buying pressure is fading. The mirror case, a lower low in price with a higher low in the indicator, is bullish divergence.
These prices and readings are round illustrative numbers. On real charts the peaks are messier and rarely line up this neatly.
Why do price and an indicator disagree?
The indicators used for divergence mostly measure momentum, the speed at which price is changing. A market can keep rising while rising more slowly, and momentum drops when that happens.
The simplest momentum indicator shows this with plain subtraction. A 5 bar momentum is the latest close minus the close 5 bars earlier. Here is a worked example with illustrative prices:
- At the first peak the close is 1.10200, and 5 bars earlier it was 1.09700.
- Momentum is 1.10200 − 1.09700 = 0.00500, which is 50 pips.
- At the second peak the close is 1.10500, and 5 bars earlier it was 1.10150.
- Momentum is 1.10500 − 1.10150 = 0.00350, which is 35 pips.
- Price is 30 pips higher than at the first peak, while momentum fell from 50 pips to 35 pips.
The second push covered fewer pips in the same number of bars. The trend was still up, at a slower pace.
RSI uses a more involved formula with the same idea behind it. It compares the size of recent up moves with recent down moves, so a slower climb with deeper pullbacks gives a lower reading, even at a higher price.
A move often loses speed before it reverses, which is why traders watch for divergence. Slowing momentum can also come before a pause, a sideways range or a trend that simply carries on more slowly.
Which indicators can show divergence?
Any indicator that rises and falls with momentum can be compared with price. These are the usual choices:
- RSI, which moves between 0 and 100.
- MACD, the gap between two exponential moving averages, read from its line or its histogram.
- The stochastic oscillator, which shows where the close sits within the recent high to low range.
- Plain momentum or rate of change, covered in the momentum indicators lesson.
Two indicators can disagree with each other on the same chart. Changing a setting, such as the RSI period from 14 to 9, can also make a divergence appear or vanish.
For that reason, choose one indicator and one setting before you study a chart. Otherwise it is easy to keep switching until you find the answer you were hoping for.
How do you spot divergence step by step?
The method is the same on any pair and any timeframe:
- Find two recent swing highs for bearish divergence, or two swing lows for bullish divergence. A swing high is a peak with lower highs on both sides, as the swing highs and lows lesson explains.
- Compare highs with highs and lows with lows. A price high is never matched with an indicator low.
- Find the indicator peaks that line up with the price peaks, on the same bar or within a bar or two.
- Draw one line across the two price points and one across the two indicator points. If the lines slope in opposite directions, you have divergence.
- Check that the two swings are fairly close together. Peaks far apart in time are harder to link to the move in front of you.
What are the four types of divergence?
In the examples so far, price makes the more extreme point. That is regular divergence, and it is read as a hint that the move may turn.
In hidden divergence the indicator makes the more extreme point instead. For example, price makes a higher low while the indicator makes a lower low, which is read as a hint that the trend may continue.
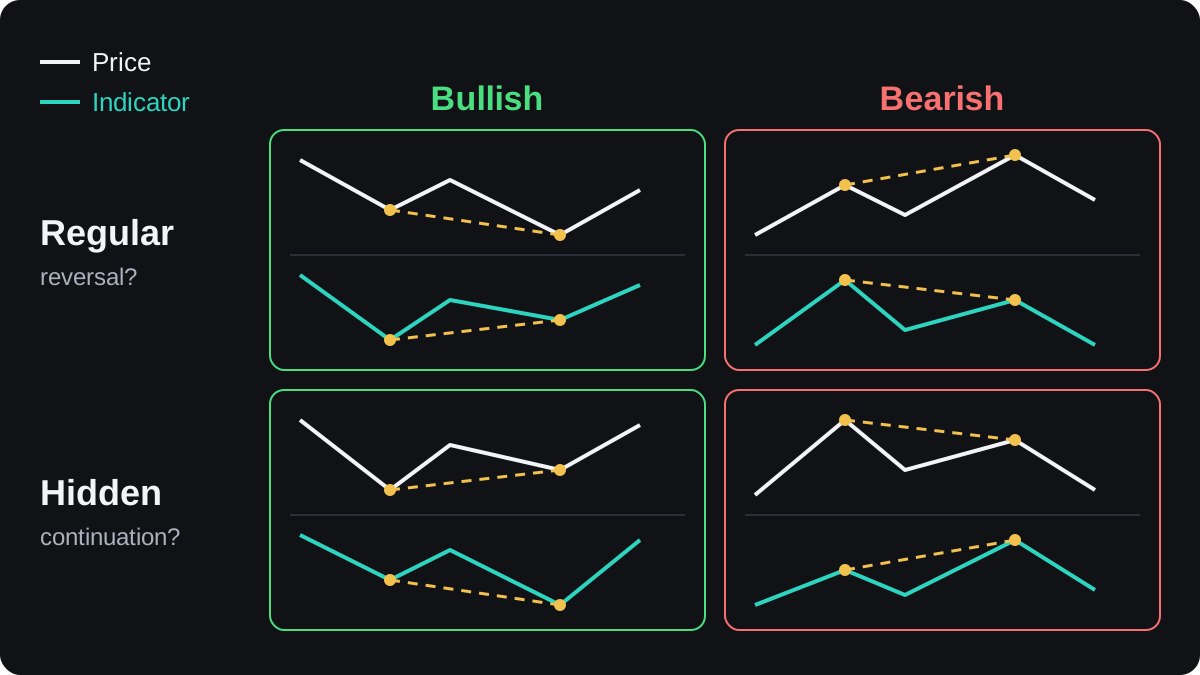
| Type | Price | Indicator | Usual reading |
|---|---|---|---|
| Regular bullish | Lower low | Higher low | Downtrend may turn up |
| Regular bearish | Higher high | Lower high | Uptrend may turn down |
| Hidden bullish | Higher low | Lower low | Uptrend may continue |
| Hidden bearish | Lower high | Higher high | Downtrend may continue |
Each form has a full lesson of its own: regular divergence and hidden divergence.
Where does divergence fail?
A strong trend can show divergence again and again without turning. Price keeps making higher highs, the indicator keeps making lower highs, and the trend carries on.
In the next example, EUR/USD peaks at 1.10200, 1.10500 and 1.10900 while RSI peaks at 72, 64 and 58. That is bearish divergence twice over, and price then climbs to 1.11000 anyway.
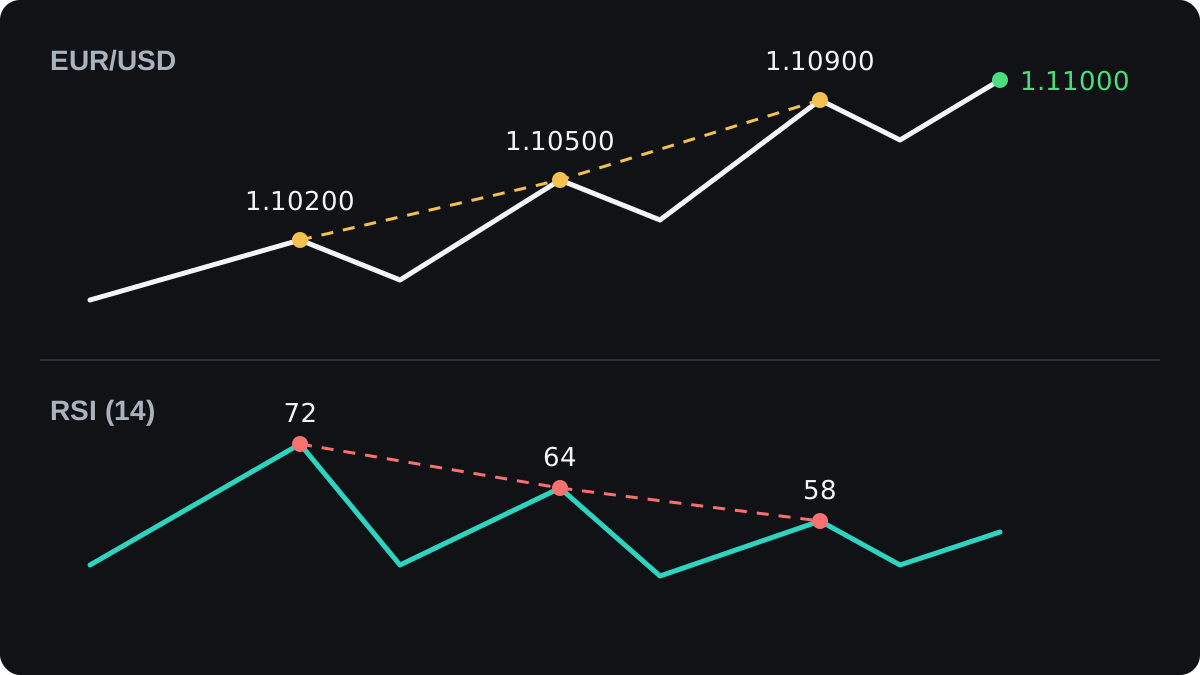
A trader who sold one standard lot at the second peak, 1.10500, would be 50 pips behind at 1.11000. In a US dollar account a pip on one lot of EUR/USD is worth $10, so that is a $500 loss before costs.
Other limits are worth knowing:
- A swing high is only confirmed after price falls away from it. In real time the second peak may not be a peak yet, so divergence looks clearer in hindsight than it does live.
- RSI and the stochastic are capped at 0 and 100. In a long trend they cannot keep climbing at the same pace, so lower highs in the indicator are common, and many lead nowhere.
- Divergence gives no entry price and no stop. You still need a rule for both, such as waiting for price to break a recent swing low.
- Lower timeframes produce more swings, so they also produce more divergences that come to nothing.
Divergence is widely taught, yet solid public evidence that it predicts reversals on its own, after costs, is thin. If you want to use it, write the rule down and test it on past data first, as the backtesting lesson shows.
أسئلة شائعة
Is divergence bullish or bearish?
It can be either. Bearish divergence is a higher high in price with a lower high in the indicator, and bullish divergence is a lower low in price with a higher low in the indicator.
Does divergence mean price will reverse?
No. It means momentum has slowed. Price can reverse, pause, move sideways or keep trending, and a strong trend can show divergence several times before any turn.
Which indicator is best for divergence?
No indicator is proven best. RSI and MACD are widely used, and they do not always agree, so pick one with fixed settings and test it before relying on it.
Can you find divergence on any timeframe?
Yes, the same comparison works on any chart. Lower timeframes show more swings, so they also show more divergences that lead nowhere.
What is the difference between regular and hidden divergence?
In regular divergence price makes the more extreme high or low, which hints at a turn. In hidden divergence the indicator makes the more extreme point, which hints that the trend may continue.
تابع التعلّم
 الفصل 4Regular divergence.Regular divergence is when price and an oscillator disagree at a turning point. In the bearish case, price makes a higher high while the oscillator makes a lower high. In the bullish case, price makes a lower low while the oscillator makes a higher low. It warns that momentum is fading, though price can keep going.
 الفصل 4Hidden divergence.Hidden divergence is when price and an oscillator disagree in a way that suggests the trend may continue. In an uptrend, price makes a higher low while the oscillator makes a lower low. In a downtrend, price makes a lower high while the oscillator makes a higher high. It is a weak signal on its own.
 الفصل 4Divergence cheat sheet.Divergence is a mismatch between price and an oscillator such as RSI. Regular divergence (price makes the new extreme, the indicator does not) hints that a trend may turn. Hidden divergence (the indicator makes the new extreme, price does not) hints that a trend may continue. Bullish types compare lows, bearish types compare highs. Neither is reliable alone.

