Regular divergence.
Regular divergence is when price and an oscillator disagree at a turning point. In the bearish case, price makes a higher high while the oscillator makes a lower high. In the bullish case, price makes a lower low while the oscillator makes a higher low. It warns that momentum is fading, though price can keep going.

Price pushes to a new high, yet the indicator under the chart stays below its last peak. When price and a momentum indicator disagree like this at the end of a trend, traders call it regular divergence.
The lesson on what divergence is covered the general idea of price and an indicator pulling apart. Regular divergence comes in two forms, one at the highs of an uptrend and one at the lows of a downtrend.
What does bearish regular divergence look like?
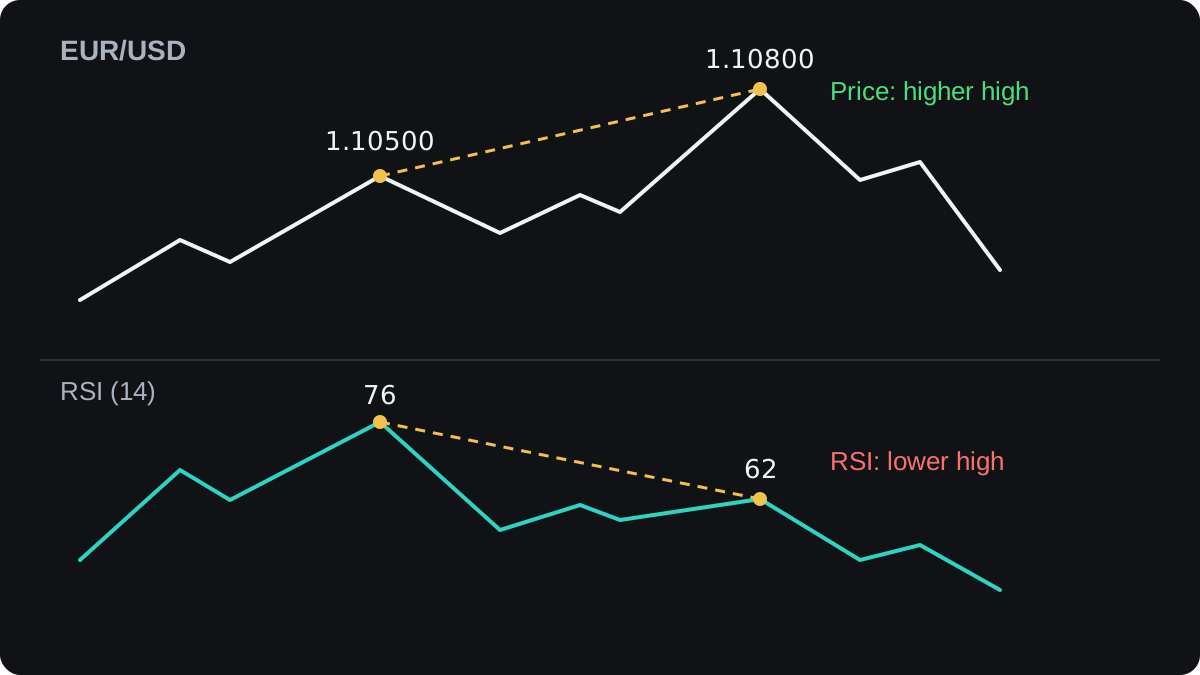
Take EUR/USD in an uptrend, with round illustrative prices. Price climbs to a swing high at 1.10500, pulls back to 1.10300, then rallies to a higher high at 1.10800.
Now check the 14-period RSI under the chart. At the first high it reads 76. At the second, higher price high, it reaches only 62.
Price made a higher high while RSI made a lower high. That pattern is bearish regular divergence. The uptrend is still climbing, yet the second push carried less force than the first.
You compare swing points, the peaks and troughs that stand out from the bars around them. The market structure lesson explains how to pick them.
Then draw one line across the two price highs and another across the RSI highs at the same bars. If the lines slope in opposite directions, the two disagree, and that disagreement is the divergence.
How does bullish regular divergence form at a low?
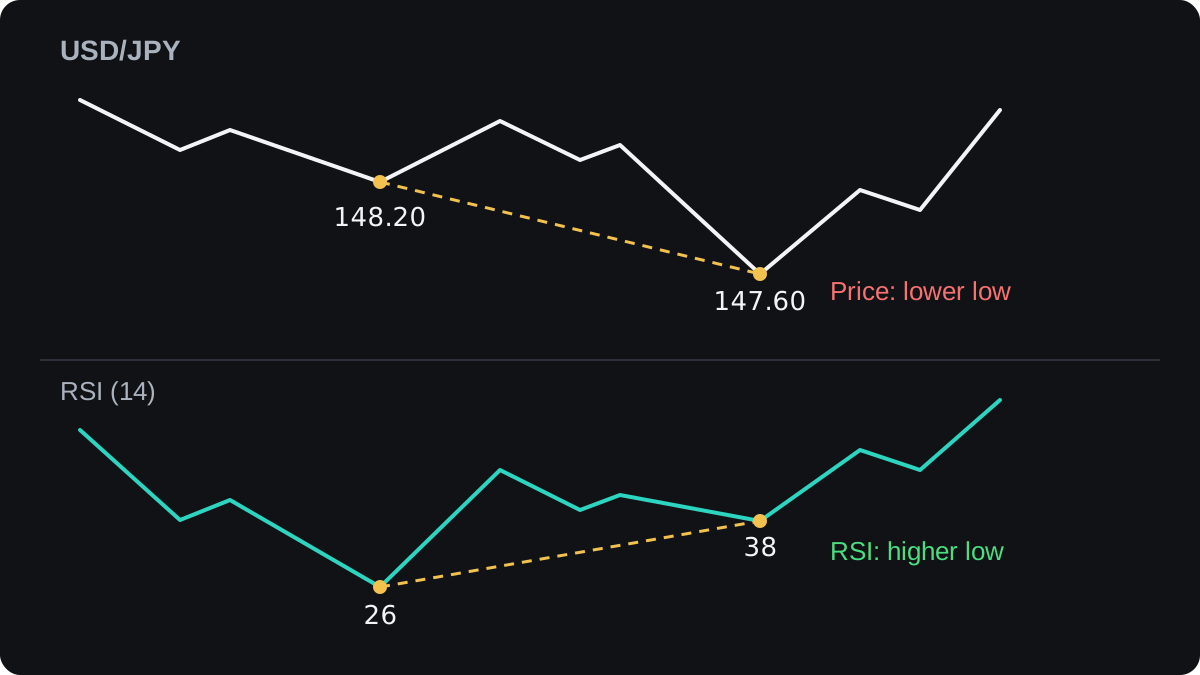
The bullish form is the mirror image. Say USD/JPY falls to a low of 148.20 with RSI at 26. After a bounce, it drops to a lower low at 147.60.
On a yen pair a pip is 0.01, so 148.20 minus 147.60 = 0.60, a further 60 pips down. RSI, though, bottoms at 38, above its earlier low of 26.
Price made a lower low while RSI made a higher low, which is bullish regular divergence. Sellers still pushed price lower, with less force the second time.
| Type | Appears in | Price | Oscillator | Possible meaning |
|---|---|---|---|---|
| Bearish regular | Uptrend | Higher high | Lower high | Uptrend may stall or reverse |
| Bullish regular | Downtrend | Lower low | Higher low | Downtrend may stall or reverse |
The same comparison works with MACD or the stochastic oscillator. Each indicator is calculated differently, so one can show divergence on a chart where another shows none.
Why does momentum fade while price still rises?
RSI compares the size of recent up moves with recent down moves over a set number of bars. A high reading means gains have outweighed losses by a wide margin.
When price creeps to a new high in small steps, or with deep pullbacks on the way, gains outweigh losses by less. RSI then peaks lower even though price peaks higher.
So regular divergence is a sign that a move has slowed. A trend can keep its direction for a long time while its speed drops.
A cyclist slowing near the top of a hill is still going up. Divergence tells you the climb has slowed, and it says nothing about how long the slower climb will last.
How could a trader build a plan around it?
Divergence on its own gives no entry price. One way to use it is to wait for price to confirm the turn, for example by breaking the swing point between the two highs.
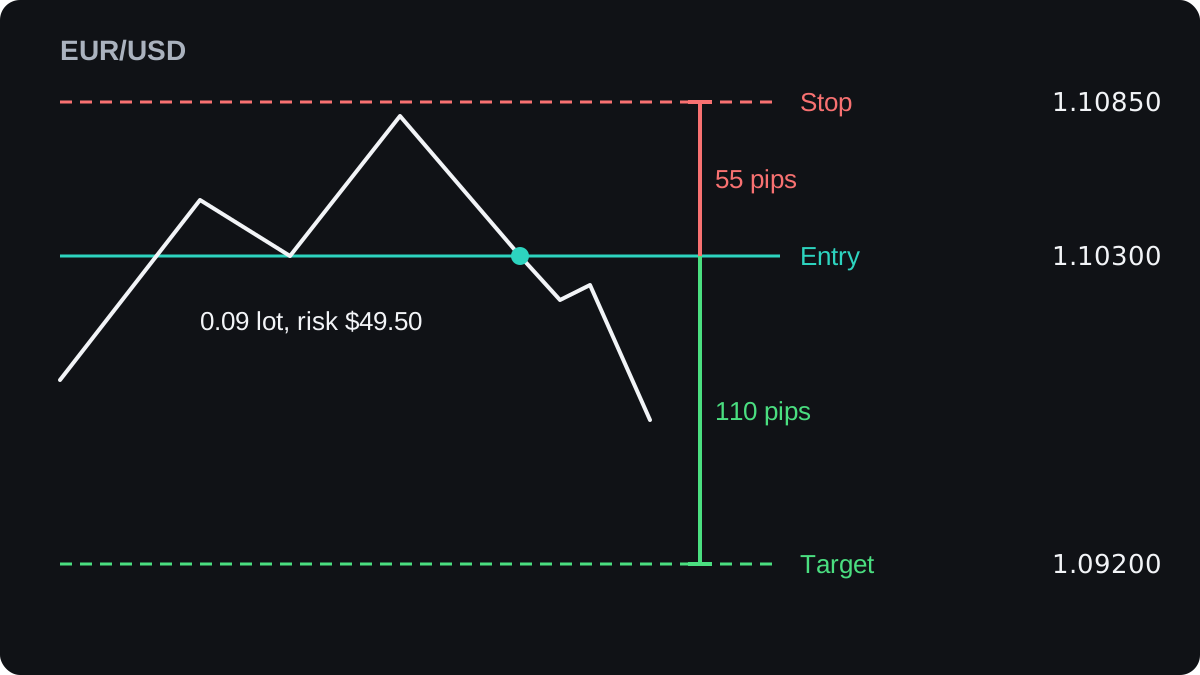
Here is one example on the EUR/USD chart above, with illustrative numbers and a $5,000 account. It shows the arithmetic and is not a recommendation to trade.
- Wait for a candle to close below 1.10300, the swing low between the two highs. For simplicity, assume you sell at 1.10300.
- Place the stop loss 5 pips above the second high: 1.10800 plus 0.00050 = 1.10850.
- The risk distance is 1.10850 minus 1.10300 = 0.00550, which is 55 pips.
- Risking 1% of $5,000 means $50. Divided by 55 pips, that allows $0.909 per pip.
- One pip on 0.01 lot of EUR/USD is worth $0.10, so $0.909 per pip is about 0.0909 lot. Round down to 0.09 lot, worth $0.90 per pip.
- The actual risk is 55 × $0.90 = $49.50.
- A target at 1.09200 is 1.10300 minus 1.09200 = 0.01100, or 110 pips away. At $0.90 per pip, that is $99.00, twice the risk.
These sums leave out the spread and any commission, which make the real result a little worse. For other pairs and account sizes, see how to calculate position size or use the lot size calculator.
Waiting for the break gives up the 50 pips between the high at 1.10800 and the entry at 1.10300. In return, divergences that never break the swing low never become trades.
Where does regular divergence fail?
A strong trend can show divergence again and again. RSI may print several lower highs while price keeps rising, and a short opened at each one would have lost.
The signal always arrives late, because a high only counts as a swing high once price has turned down from it. The divergence becomes visible some bars after the second peak.
An oscillator can also make a lower high just because the first reading was extreme. After a reading near 90, a lower second peak says little about the health of the trend.
Timeframes can disagree. A bearish divergence on a 15-minute chart may sit inside a firm uptrend on the daily chart, where it carries little weight.
There is little solid public evidence that divergence alone predicts reversals. Any test depends heavily on how you define a swing and an entry, so treat it as one input among several.
The lesson on oscillators in trends shows why momentum tools mislead in strong moves. Hidden divergence, the next lesson, turns the logic around and looks for signs that a trend will continue.
Questions
What is the difference between regular and hidden divergence?
Regular divergence forms at the highs of an uptrend or the lows of a downtrend and hints at a possible reversal. Hidden divergence forms on pullbacks inside a trend and hints that the trend may continue.
Does regular divergence mean the trend will reverse?
No. It means momentum has faded. Price can keep trending, move sideways or reverse, which is why the example plan waits for a break of the last swing low.
Which indicator is best for spotting divergence?
RSI, MACD and the stochastic oscillator are common choices, and none has been shown to be clearly best. Pick one, keep its settings fixed and compare swings on that same tool.
Which timeframe works best for regular divergence?
No timeframe is reliably best. Signals on higher timeframes form more slowly and contain less short-term noise, and a signal that goes against the trend on a larger chart deserves extra caution.
Keep learning
 Chapter 4What is divergence?Divergence is when price and an indicator disagree. Price makes a new high or low, but an oscillator such as RSI or MACD does not make a matching one. It warns that the move is losing speed. It does not say when, or whether, price will turn, and it can last a long time.
 Chapter 4Hidden divergence.Hidden divergence is when price and an oscillator disagree in a way that suggests the trend may continue. In an uptrend, price makes a higher low while the oscillator makes a lower low. In a downtrend, price makes a lower high while the oscillator makes a higher high. It is a weak signal on its own.
 Chapter 4Divergence cheat sheet.Divergence is a mismatch between price and an oscillator such as RSI. Regular divergence (price makes the new extreme, the indicator does not) hints that a trend may turn. Hidden divergence (the indicator makes the new extreme, price does not) hints that a trend may continue. Bullish types compare lows, bearish types compare highs. Neither is reliable alone.

