Momentum indicators and how to read them.
A momentum indicator measures how fast price is changing by comparing the latest close with the close a set number of bars ago. When the line is above zero, price is higher than it was. A falling line means the move is slowing. It warns of a weakening trend but does not tell you when, or whether, price will reverse.

Say EUR/USD climbs for ten trading days straight. The trend looks healthy, yet the daily gains have shrunk from 20 pips to 5. A momentum indicator turns that slowdown into a line you can read on a chart.
What does a momentum indicator measure?
Momentum is the speed of a price move: how far price has travelled over a fixed number of bars. A momentum indicator compares the latest close with the close a set number of bars earlier.
Direction and speed are separate facts. A pair can keep rising while each rise gets smaller, and a momentum reading is built to catch that slowdown.
Momentum indicators belong to the family of oscillators. The basic momentum line has no upper or lower limit, unlike the RSI, which stays between 0 and 100.
How do you calculate momentum?
The simplest version is one subtraction:
Momentum = latest close minus the close n bars ago
Here n is the lookback period you choose. A short period reacts fast and is jumpy. A long period is smoother and slower to turn.
Take 5-day momentum on EUR/USD with round illustrative closes. A pip on this pair is 0.0001, so a difference of 0.00800 is 80 pips.
| Day | Close | Close 5 days earlier | 5-day momentum |
|---|---|---|---|
| 1 | 1.10000 | too early | too early |
| 2 | 1.10100 | too early | too early |
| 3 | 1.10250 | too early | too early |
| 4 | 1.10400 | too early | too early |
| 5 | 1.10600 | too early | too early |
| 6 | 1.10800 | 1.10000 | +80 pips |
| 7 | 1.11000 | 1.10100 | +90 pips |
| 8 | 1.11150 | 1.10250 | +90 pips |
| 9 | 1.11250 | 1.10400 | +85 pips |
| 10 | 1.11300 | 1.10600 | +70 pips |
The day 10 reading, step by step:
- The day 10 close is 1.11300.
- Five days earlier, on day 5, the close was 1.10600.
- 1.11300 minus 1.10600 = 0.00700, which is 70 pips.
Price closed higher every day from day 2 to day 10. Momentum peaked at 90 pips on days 7 and 8 and fell to 70 by day 10, because each new day added less than the day it pushed out of the window.
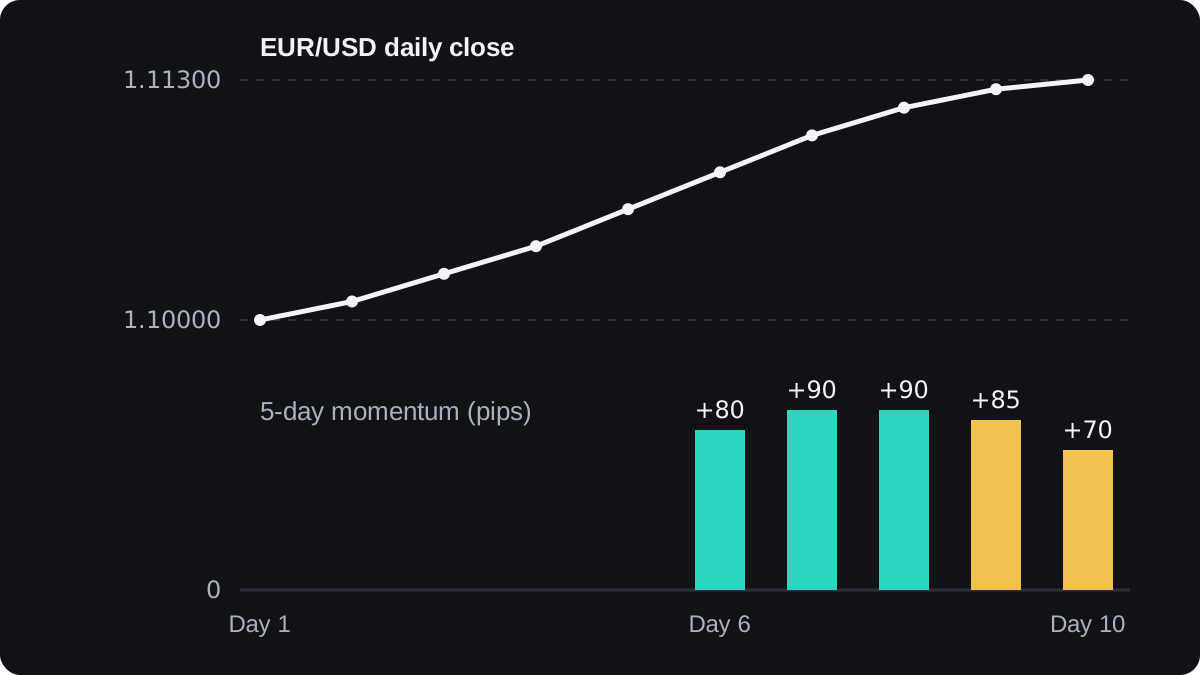
Each reading is the sum of the last five daily changes. On day 10 the window gained day 10's rise of 5 pips and lost day 5's rise of 20 pips, so the reading fell from 85 to 70.
The same mechanism has a side effect. A reading can jump or drop on a quiet day simply because a large bar has left the window.
Momentum in pips, percent or ratio
The same idea comes in three common forms. All three use the same two closes and differ only in their units.
| Form | Formula | Day 10 value |
|---|---|---|
| Momentum | Close minus close n bars ago | 0.00700 (70 pips) |
| Rate of change (ROC) | (Close minus close n bars ago) ÷ close n bars ago × 100 | 0.63% |
| Ratio | Close ÷ close n bars ago × 100 | 100.63 |
For day 10: 0.00700 ÷ 1.10600 × 100 = 0.63%, and 1.11300 ÷ 1.10600 × 100 = 100.63.
MetaTrader's built-in Momentum indicator uses the ratio form, so its neutral line sits at 100 instead of 0. Check the indicator's description on your own platform before reading its numbers.
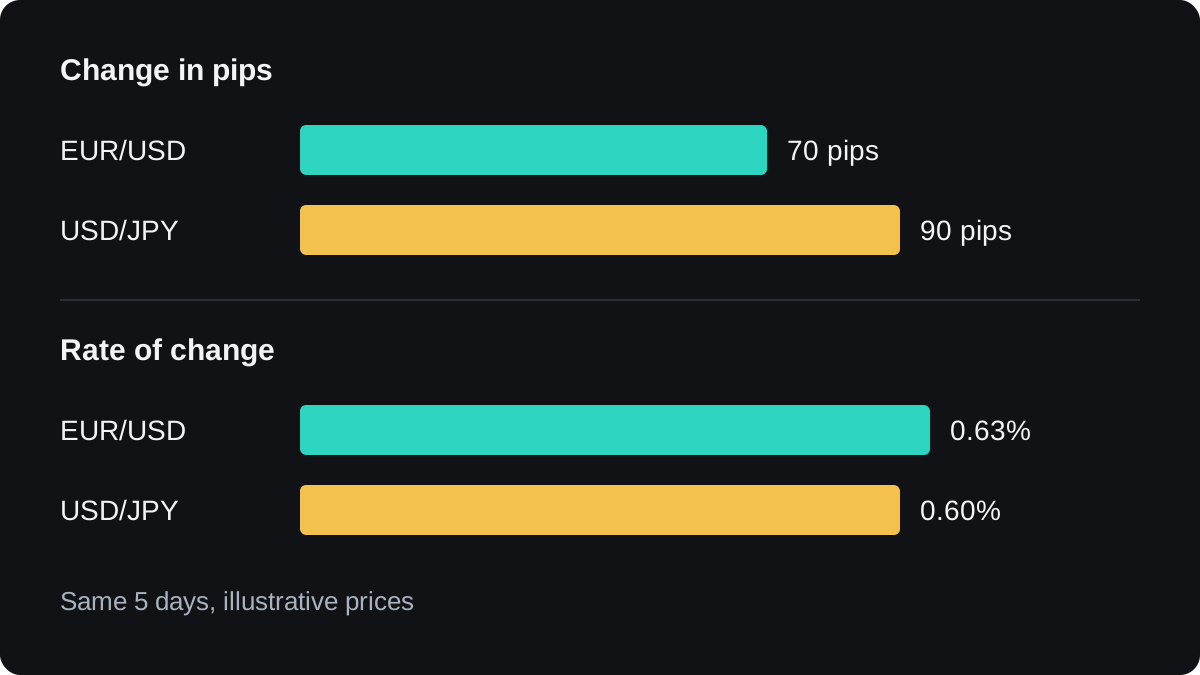
The percentage forms let you compare pairs. Pips cannot, because one pip is a different share of the price on each pair.
Over the same five days, say USD/JPY rose from 150.00 to 150.90. On a yen pair a pip is 0.01, so that is 90 pips, more than the 70 pips on EUR/USD.
As a rate of change it is 0.90 ÷ 150.00 × 100 = 0.60%, a little less than the 0.63% on EUR/USD. The pair with more pips was the slower mover.
How do you read a momentum line?
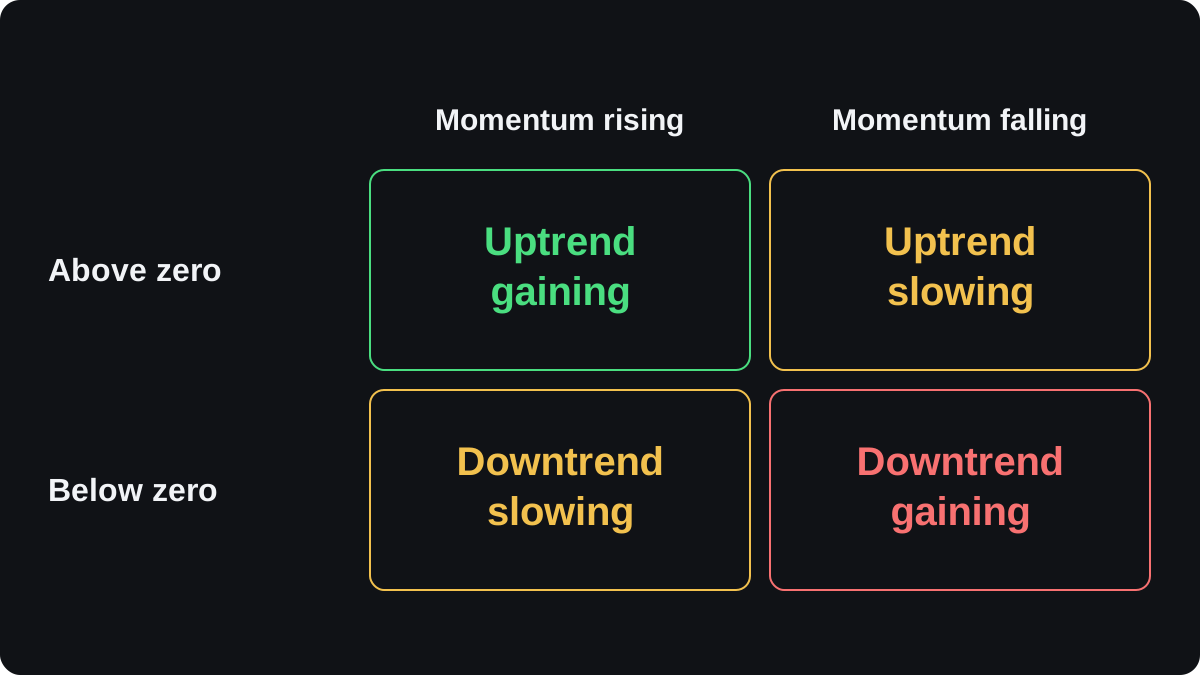
Start with the side of the zero line. Above zero, price is higher than it was n bars ago. Below zero, it is lower.
Then read the slope, which says whether that gap is widening or narrowing. Put together, the two readings give four states.
A cross of the zero line comes late. It means price is back where it was n bars ago, so the whole move inside the window has already been given back.
The slope turns earlier. In the EUR/USD example, momentum turned down on day 9 while price was still making new highs.
That early turn is why momentum is sometimes grouped with leading indicators. It is still built from past closes, so it reacts to slowing that has already happened and cannot see the next bar.
The MACD is a momentum measure too. It tracks the gap between two moving averages, and a shrinking gap is read the same way as a falling momentum line.
What does it mean when price and momentum disagree?
The ten-day example ends with price at a new high and momentum at a lower peak than before. That mismatch is called divergence.
Divergence says the move is losing speed. It does not say when price will turn, or whether it will turn at all, because a trend can pause and then speed up again.
In a strong trend, momentum can stay high or diverge several times while price keeps going. The lesson on oscillators in trending markets covers that problem in more detail.
A falling line also does not mean the trend has ended. While momentum is above zero, price is still higher than it was n bars ago.
Where momentum readings fail
- The period changes the picture. A 5-day line and a 20-day line on the same chart can point in opposite directions.
- The raw line has no fixed overbought or oversold levels. A reading of 90 pips is large on one pair and timeframe and ordinary on another.
- The drop-off effect adds noise, as the day 10 example showed.
- In a choppy market, where price swings without a trend, the slope turns often and gives many false warnings.
Whether a momentum rule makes money depends on the period, the pair, the market phase and your costs. No setting is known to hold up everywhere, so backtest any rule and try it on a demo before using real money.
Questions
What is the difference between momentum and RSI?
The momentum line is the raw price change over n bars and has no fixed range. RSI compares average gains with average losses over n bars and is scaled to stay between 0 and 100.
What period should I use for a momentum indicator?
There is no correct period. Many platforms default to 14 bars, which is a convention. Shorter periods react faster with more false turns, and longer ones are smoother and later.
Does momentum above zero mean I should buy?
No. It only means price is higher than it was n bars ago. Whether to trade depends on your plan, your stop and your risk, and the indicator says nothing about those.
Is momentum a leading or lagging indicator?
It is calculated from past closes, so strictly it lags price. Its slope often turns before price does, which can warn of a slowdown early, along with plenty of false warnings.
Keep learning
 Chapter 1Leading and lagging indicators.A leading indicator tries to signal a turn before it happens, usually by measuring when a move is slowing, as RSI and the stochastic do. A lagging indicator, such as a moving average, confirms a move after it starts. Leading tools give more false alarms; lagging tools miss the start of each move.
 Chapter 1What are oscillators?An oscillator is an indicator that moves back and forth inside a fixed range such as 0 to 100, or around a centre line such as zero. It compares the latest price with recent prices. A high reading means price is near the top of its recent range, and does not mean price must fall.
 Chapter 1Using oscillators when the market trends.In a strong trend, an oscillator such as RSI can stay overbought or oversold for a long time, so a reading above 70 is a weak reason to sell on its own. In a trend you flip the reading: wait for the oscillator to dip during a pullback and turn back with the trend, and still use a stop loss.
 Chapter 1Oscillators and momentum cheat sheet.RSI and the stochastic run from 0 to 100 and are read at fixed levels such as 70 and 30. MACD, momentum and CCI have no fixed range and are read around a centre line. All are built from past prices, so an overbought reading can last through a strong trend and is not a sell signal by itself.

