Oscillators and momentum cheat sheet.
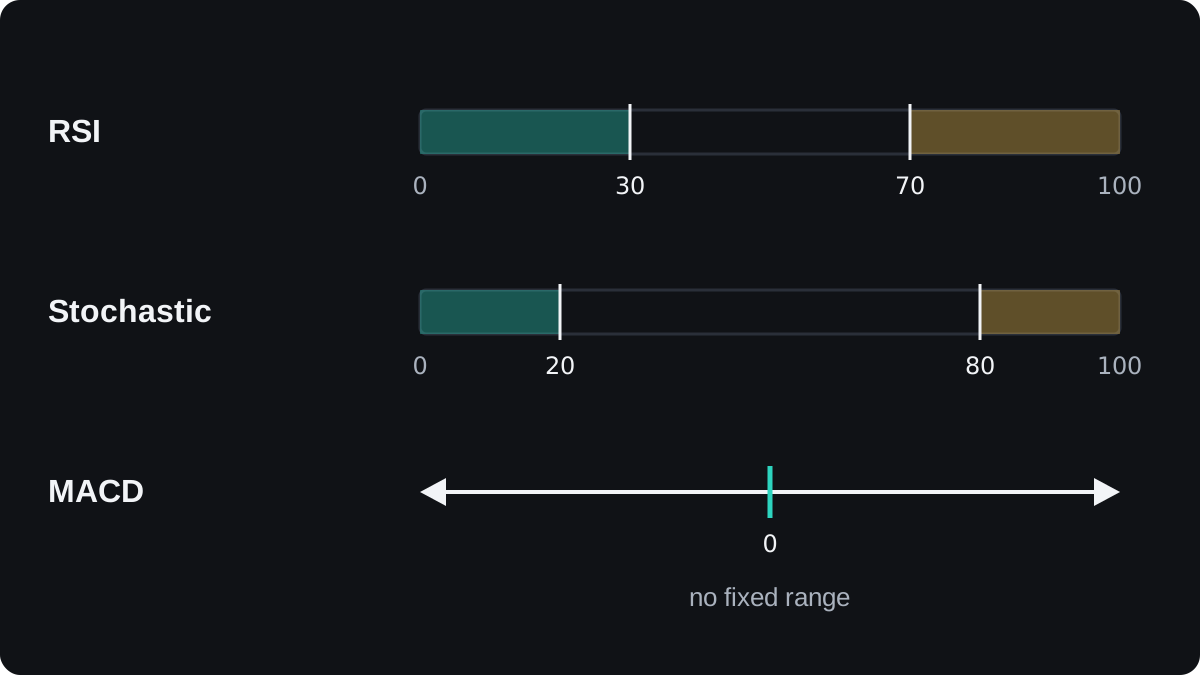
RSI and the stochastic run from 0 to 100 and are read at fixed levels such as 70 and 30. MACD, momentum and CCI have no fixed range and are read around a centre line. All are built from past prices, so an overbought reading can last through a strong trend and is not a sell signal by itself.

This page collects the oscillator and momentum tools from this chapter. All example numbers are round and illustrative.
What does each oscillator compare?
An oscillator turns recent prices into a line that swings between fixed limits or around a centre.
| Indicator | Common setting | Range and levels | Compares |
|---|---|---|---|
| RSI | 14 | 0 to 100; 70 and 30 | Average gain with average loss |
| Stochastic | 14, 3, 3 | 0 to 100; 80 and 20 | Close with the recent range |
| Williams %R | 14 | −100 to 0; −20 and −80 | Stochastic on a −100 to 0 scale |
| MACD | 12, 26, 9 | Unbounded; zero line | Fast EMA minus slow EMA |
| Momentum | 14 | Unbounded; 0, or 100 on MetaTrader | Close with the close 14 bars ago |
| CCI | 20 | Unbounded; +100 and −100 | Typical price with its average |
Defaults differ between platforms, so check what your chart uses. RSI and the stochastic cannot leave 0 to 100, so fixed overbought and oversold lines suit them.
MACD and momentum have no ceiling and are read around zero. CCI is unbounded too, despite its lines at +100 and −100.
Which signals do traders read, and where do they fail?
- Overbought or oversold: RSI above 70 or below 30, the stochastic above 80 or below 20. A strong trend can hold the reading there for many bars.
- Centre line cross: RSI through 50, MACD through zero. It filters noise but arrives late.
- Signal line cross: %K through %D, MACD through its signal line. In choppy markets many reverse within a few bars.
- Divergence: price makes a new high while the oscillator makes a lower high, or the reverse at lows. A divergence has no timer.
Oscillators are often called leading indicators because they can turn first, yet each is calculated from past prices.
Worked example: four readings on one EUR/USD chart
Take an hourly EUR/USD chart with these inputs.
RSI
- Over 14 bars, the smoothed average gain is 30 pips and the average loss is 15 pips.
- RS = 30 ÷ 15 = 2.
- RSI = 100 − 100 ÷ (1 + 2) = 100 − 33.33 = 66.67.
Stochastic
- Over 14 bars, the highest high is 1.1000 and the lowest low is 1.0900. The latest close is 1.0980.
- Raw %K = (1.0980 − 1.0900) ÷ (1.1000 − 1.0900) × 100 = 0.0080 ÷ 0.0100 × 100 = 80.
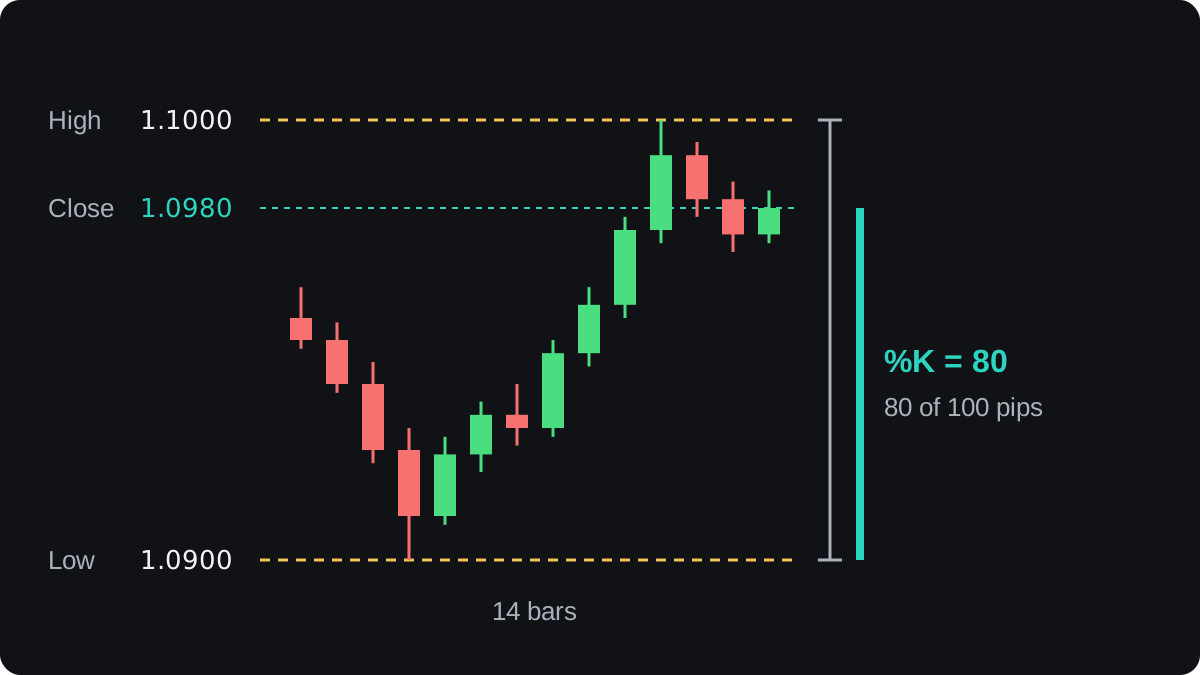
The 14, 3, 3 setting smooths this: if the last three raw readings were 71, 74 and 80, the plotted %K is (71 + 74 + 80) ÷ 3 = 75. %D is a 3-bar average of that line.
MACD and momentum
- The 12-period EMA is 1.09520 and the 26-period EMA is 1.09320, so MACD = 0.00200, a gap of 20 pips.
- With the signal line at 0.00150, the histogram is 0.00200 − 0.00150 = 0.00050.
- The close 14 bars ago was 1.0900, so momentum is 1.0980 − 1.0900 = 0.0080, or 80 pips.
- MetaTrader divides instead: 1.0980 ÷ 1.0900 × 100 = 100.73.
All four lean upward, but they come from the same bars, so they are close to one piece of evidence counted four times. The lesson on combining indicators pairs tools that measure different things.
MACD and momentum are in price units: a 20 pip gap reads 0.00200 on EUR/USD and 0.20 on USD/JPY. Compare them over time on one pair only.
How do the readings behave in a trend?
Fixed levels fit a range best. Below, EUR/USD climbs from 1.0800 to 1.1000 while RSI(14) keeps returning above 70 and each pullback stops in the 60s, far from 30.
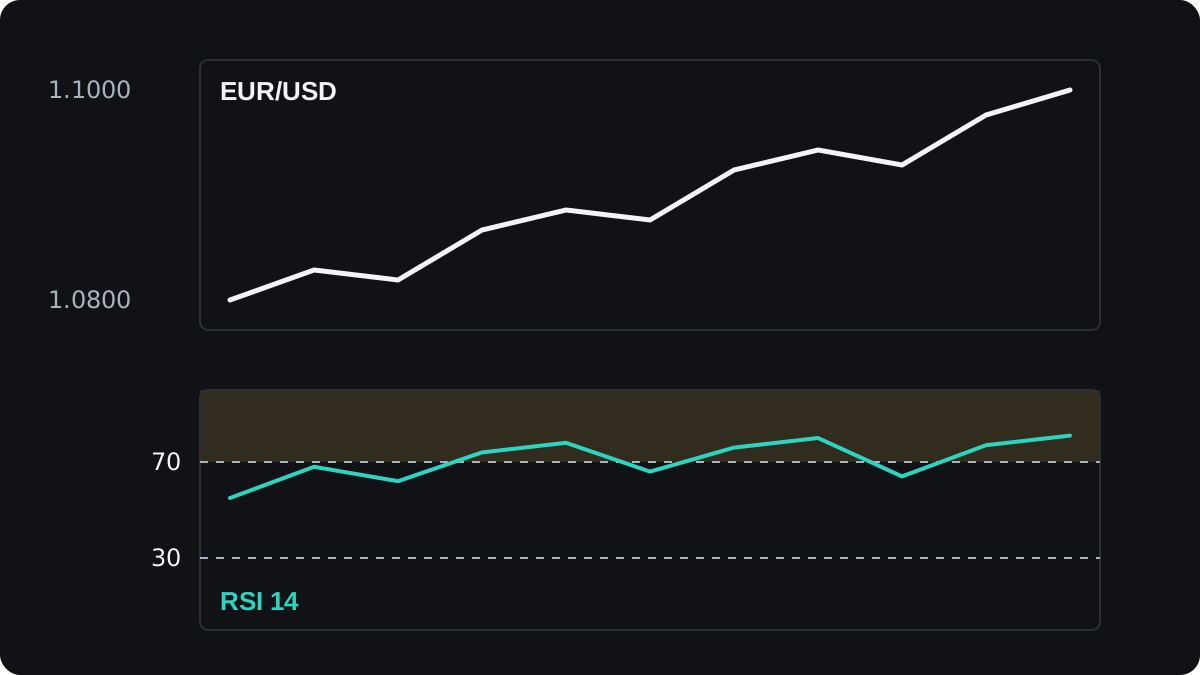
Selling each cross above 70 would have meant selling into the trend again and again. Watching where dips stop is a reading habit that has not been tested as a rule on its own; the lesson on oscillators in trends covers it.
Settings and pitfalls to check before you trust a reading
A 7-bar RSI reaches 70 and 30 far more often than a 21-bar RSI, giving more signals and more false ones. Settings tuned to fit past charts can still do no better than chance on new data.
- A reading on an open bar can change until it closes, so a cross can vanish.
- MetaTrader 4 draws the MACD line itself as bars, with a simple average as the signal line.
- Overbought readings and divergence say nothing about timing.
- Costs come off every trade, so a rule that fires often needs a larger edge.
Evidence that simple overbought and oversold rules beat chance in currency markets is weak and mixed, so test any rule on your own pairs, with costs, before risking money.
Questions
What is the best RSI setting?
None is best everywhere. 14 is the usual default; shorter periods give more and noisier signals, longer ones fewer and later.
Does overbought mean the price will fall?
No. It means price has risen a lot over the look-back period, and in a strong trend the reading can stay high.
Should I use RSI or the stochastic?
Both measure similar things from the same prices, so using both adds little. Learn one well first.
What does the MACD histogram show?
The MACD line minus its signal line. In the example, 0.00200 minus 0.00150 gives 0.00050.
Are oscillators leading indicators?
They can turn before price, which is why they are called leading. They are still built from past prices, so price can ignore the turn.
Keep learning
 Chapter 1Leading and lagging indicators.A leading indicator tries to signal a turn before it happens, usually by measuring when a move is slowing, as RSI and the stochastic do. A lagging indicator, such as a moving average, confirms a move after it starts. Leading tools give more false alarms; lagging tools miss the start of each move.
 Chapter 1What are oscillators?An oscillator is an indicator that moves back and forth inside a fixed range such as 0 to 100, or around a centre line such as zero. It compares the latest price with recent prices. A high reading means price is near the top of its recent range, and does not mean price must fall.
 Chapter 1Using oscillators when the market trends.In a strong trend, an oscillator such as RSI can stay overbought or oversold for a long time, so a reading above 70 is a weak reason to sell on its own. In a trend you flip the reading: wait for the oscillator to dip during a pullback and turn back with the trend, and still use a stop loss.
 Chapter 1Momentum indicators and how to read them.A momentum indicator measures how fast price is changing by comparing the latest close with the close a set number of bars ago. When the line is above zero, price is higher than it was. A falling line means the move is slowing. It warns of a weakening trend but does not tell you when, or whether, price will reverse.

