Divergence cheat sheet.
Divergence is a mismatch between price and an oscillator such as RSI. Regular divergence (price makes the new extreme, the indicator does not) hints that a trend may turn. Hidden divergence (the indicator makes the new extreme, price does not) hints that a trend may continue. Bullish types compare lows, bearish types compare highs. Neither is reliable alone.
Ce contenu n'existe pour l'instant qu'en anglais.

Divergence comes in four versions with easily confused names. Each compares two swing points on price with the same two points on a momentum oscillator, such as the RSI or the MACD.
What are the four types of divergence?
Bullish divergence always compares two swing lows, and bearish divergence two swing highs. The question is which line makes the new extreme: price or the oscillator.
| Type | Price | Oscillator | What it suggests | Usual setting |
|---|---|---|---|---|
| Regular bullish | Lower low | Higher low | Downtrend may be losing momentum | After a fall |
| Regular bearish | Higher high | Lower high | Uptrend may be losing momentum | After a rise |
| Hidden bullish | Higher low | Lower low | Uptrend may resume | Pullback in an uptrend |
| Hidden bearish | Lower high | Higher high | Downtrend may resume | Bounce in a downtrend |
In the sketches, the dashed lines on price and oscillator always slope opposite ways.
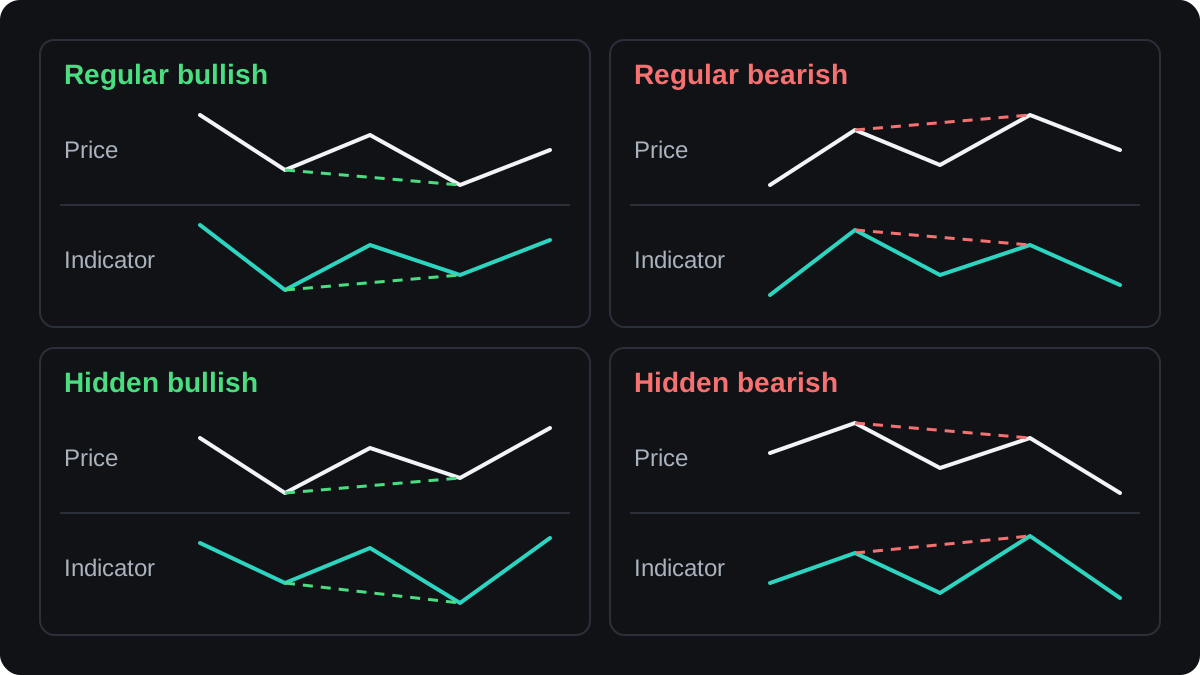
The last column matters too: a hidden bullish pattern in a clear downtrend has no uptrend to continue.
How do you tell regular from hidden?
Regular divergence means price makes a new extreme and the oscillator does not, suggesting the move is losing momentum and may turn.
Hidden divergence is the mirror image: the oscillator makes the new extreme and price does not. It usually ends a pullback inside a trend and suggests the trend may carry on.
Two questions sort any case. Lows mean bullish and highs mean bearish. If price went further, it is regular; if the oscillator did, it is hidden.
Try USD/JPY in a downtrend. Price makes a high at 151.80, then a lower high at 151.20, 60 pips lower since a yen pip is 0.01. The RSI reads 58, then 64.
Highs mean bearish and the oscillator went further, so this is hidden bearish divergence: the downtrend may resume.
What to check before you call a divergence
- Use clear swing points: a swing low has higher lows on both sides, a swing high lower highs (see the market structure lesson).
- Line up the points: the oscillator's swing should sit under the same candles, within a bar or two.
- Compare closes with closes, or wicks with wicks. The RSI is calculated from closes, so closes keep both lines on the same footing.
- Wait for the second swing to finish, which means every divergence is seen a few bars late.
- Fix your settings. RSI 14 and RSI 7 can disagree on the same chart, and so can the MACD line and histogram.
- Decide in advance what confirms the signal, such as a break of the swing point between the two.
A worked example: regular bullish divergence on EUR/USD
Prices are round and illustrative, and the entry rule is an example with no proven edge.
On a 4-hour EUR/USD chart, price falls to a swing low at 1.08200, where the 14-period RSI reads 28. Price bounces to 1.08600, then falls again.
The second low is 1.08050. That is 1.08200 minus 1.08050 = 0.00150, a lower low by 15 pips. The RSI there reads 34, a higher low by 6 points.
Lows mean bullish and price went further, so this is regular bullish divergence.
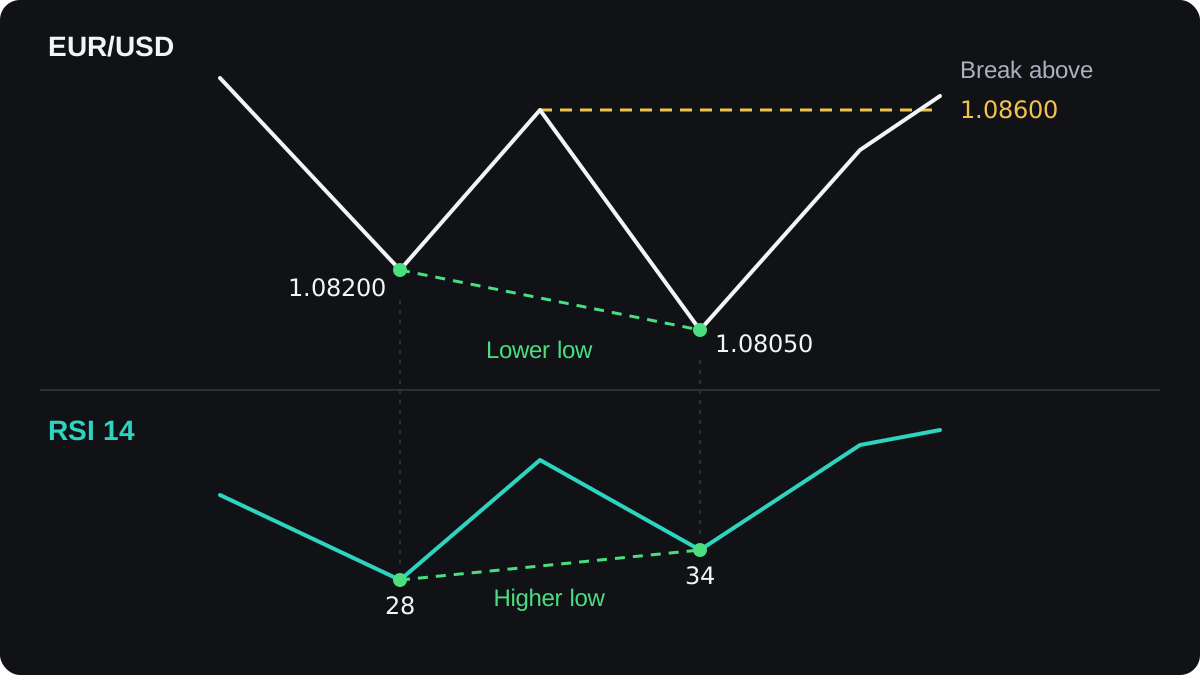
The example rule enters on a break of 1.08600, the swing high between the lows, using a buy stop order, explained in the order types lesson.
Size it from the stop, in a USD account:
- Stop at 1.08000, five pips below the second low: 1.08600 minus 1.08000 = 0.00600, or 60 pips.
- Risk budget: 1% of a $5,000 account is $50.
- Per pip: $50 ÷ 60 = $0.833. A 0.01 lot of EUR/USD is $0.10 per pip, so round down to 0.08 lot, $0.80 per pip.
- Risk at the stop: 60 × $0.80 = $48. At 0.09 lot it would be $54, over budget.
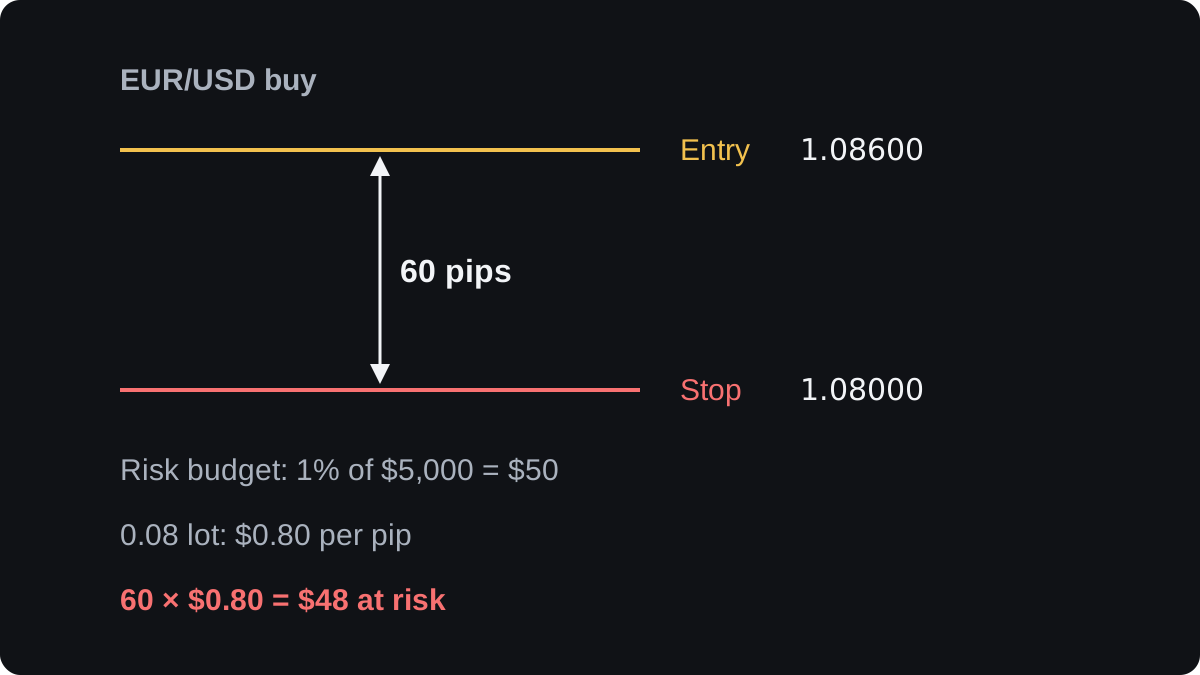
These sums ignore spread and slippage, so the real loss could exceed $48 slightly. The lot size calculator repeats step 3 for other pairs. If price never reaches 1.08600, you cancel the order.
Where divergence fails
Divergence measures momentum, and momentum can fade while a trend carries on. In a strong uptrend the RSI can make several lower highs while price keeps climbing, with no turn at all.
It gives no timing either: it says momentum slowed, not when or whether price will turn.
The reading is also subjective. Two traders can mark different swings on one chart and reach opposite conclusions.
There is little solid public evidence that divergence alone predicts price well enough to profit after costs. Backtest your exact rules on your pair and timeframe before risking money on it.
Questions fréquentes
What is the difference between bullish and bearish divergence?
Bullish divergence compares two swing lows and hints at a move up. Bearish divergence compares two swing highs and hints at a move down.
Which indicator is best for spotting divergence?
None has been shown to be best. RSI, MACD and the stochastic all measure momentum, so pick one and keep its settings fixed.
Is hidden divergence more reliable than regular divergence?
There is no solid evidence either way. Hidden divergence follows the existing trend, so it fails when that trend is ending.
What timeframe should I use for divergence?
Any timeframe works. Lower timeframes show many more divergences, each usually covering a smaller move.
Can divergence appear without a reversal?
Yes, especially in a strong trend. Treat it as a reason to watch, and always know where your stop loss is.
Continuer à apprendre
 Chapitre 4What is divergence?Divergence is when price and an indicator disagree. Price makes a new high or low, but an oscillator such as RSI or MACD does not make a matching one. It warns that the move is losing speed. It does not say when, or whether, price will turn, and it can last a long time.
 Chapitre 4Regular divergence.Regular divergence is when price and an oscillator disagree at a turning point. In the bearish case, price makes a higher high while the oscillator makes a lower high. In the bullish case, price makes a lower low while the oscillator makes a higher low. It warns that momentum is fading, though price can keep going.
 Chapitre 4Hidden divergence.Hidden divergence is when price and an oscillator disagree in a way that suggests the trend may continue. In an uptrend, price makes a higher low while the oscillator makes a lower low. In a downtrend, price makes a lower high while the oscillator makes a higher high. It is a weak signal on its own.
Courtiers partenaires

