Moving averages cheat sheet.
A moving average is the average of recent closing prices, recalculated on every new bar. The SMA weights the last N closes equally, and the EMA weights recent closes more, so it reacts faster. Traders use the slope for trend, fast and slow crossovers as signals and the line as moving support or resistance, and every version lags price.
Konten ini baru tersedia dalam bahasa Inggris.

A moving average turns a jagged run of prices into one smooth line, redrawn on every new bar. This sheet puts the module's formulas and signals on one page, with a worked example you can redo by hand.
How is a simple moving average calculated?
Take five daily closes of EUR/USD, round illustrative prices: 1.1000, 1.1020, 1.1010, 1.1040 and 1.1030. Their average, 1.10200, is a 5-period simple moving average.
A simple moving average (SMA) is the plain average of the last N closes, each with equal weight. On each new bar the oldest close drops out and the newest comes in.
- Sum: 1.1000 + 1.1020 + 1.1010 + 1.1040 + 1.1030 = 5.5100.
- Average: 5.5100 ÷ 5 = 1.10200.
- The next day closes at 1.1100. Drop 1.1000 and add 1.1100, so the sum is 5.5200.
- New average: 5.5200 ÷ 5 = 1.10400, a rise of 20 pips.
The simple moving average lesson covers longer periods.
How does an EMA differ from an SMA?
An exponential moving average (EMA) gives the newest close the most weight. On each bar it moves a fixed share k of the gap between its last value and the new close:
EMA today = EMA yesterday + k × (close minus EMA yesterday)
Here k = 2 ÷ (N + 1), so for 5 periods k is one third. A common start is to seed the first EMA with the SMA, 1.10200. Then feed in the same new close, 1.1100.
- Gap: 1.1100 minus 1.10200 = 0.00800.
- One third: 0.00800 ÷ 3 = 0.00267, rounded.
- New EMA: 1.10200 + 0.00267 = 1.10467, a rise of 26.7 pips.
The newest close carries one third of the weight in the EMA, against one fifth in the SMA.
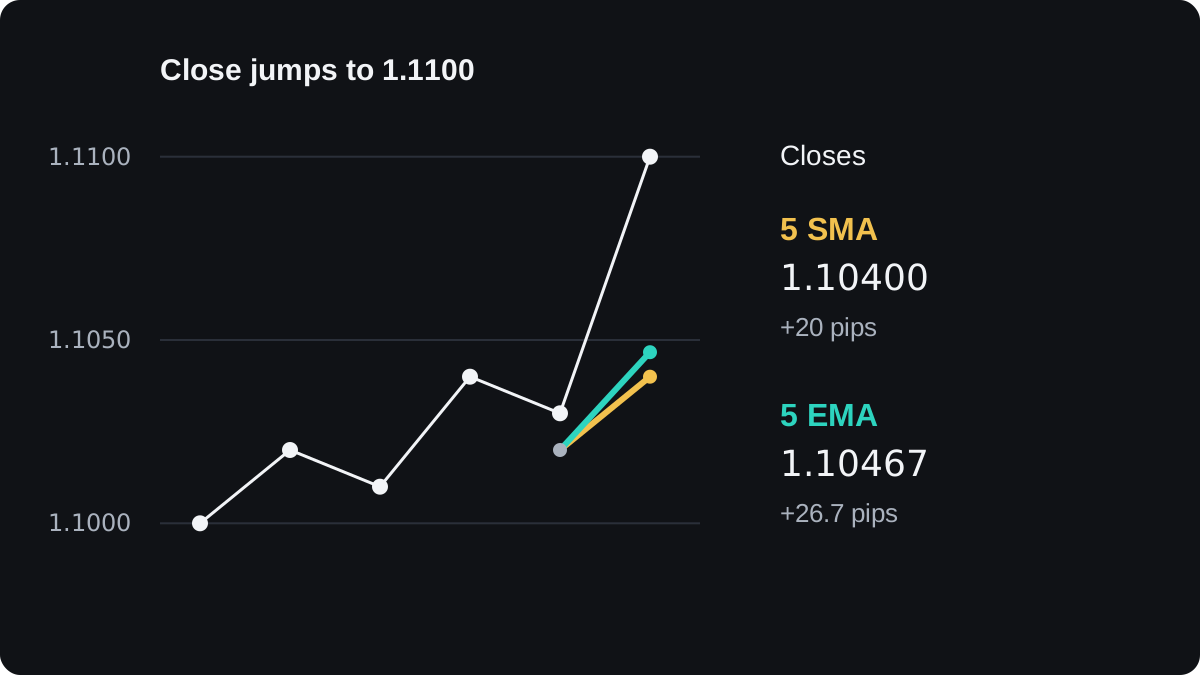
Platforms do not all seed the first EMA the same way, so early values can differ between charts. The difference fades as more bars arrive.
| Feature | SMA | EMA |
|---|---|---|
| Weight on closes | Equal across N closes | Largest on the newest close |
| Reaction to a jump | Slower | Faster |
| Old prices | Drop out after N bars | Fade but never fully vanish |
| In choppy markets | Tends to give fewer false signals | Tends to give more false signals |
The SMA or EMA lesson weighs speed against noise, and the EMA lesson runs the formula over many bars.
Which lengths do traders watch, and how far behind do they sit?
No single length is best for every pair and timeframe.
| Length | Common use |
|---|---|
| 20 | Short-term trend, about four weeks of daily bars |
| 50 | Medium-term trend |
| 200 | Long-term trend on daily charts |
Every moving average has lag: it reports where price has been. An N-period SMA is centred about (N minus 1) ÷ 2 bars back, so 9.5 bars for a 20 SMA and 99.5 bars for a 200 SMA.
Longer averages are smoother and slower to turn.
How do you read the trend from a moving average?
Check the slope of the line and which side of it price is on.
| What you see | Usual reading |
|---|---|
| Price above a rising average | Uptrend |
| Price below a falling average | Downtrend |
| Flat average, price crossing it often | No clear trend |
| Price above a falling average, or below a rising one | Mixed: a pause or an early turn |
Signals are weakest when the average is flat and price weaves through it. The trend direction lesson works through each case, and trending versus ranging markets shows how to tell them apart.
How do crossovers work, and when do they fail?
A crossover is a faster average crossing a slower one. Fast above slow is read as bullish, and fast below slow as bearish.
On daily charts, the 50-period average crossing above the 200-period one is usually called a golden cross, and 50 below 200 a death cross.
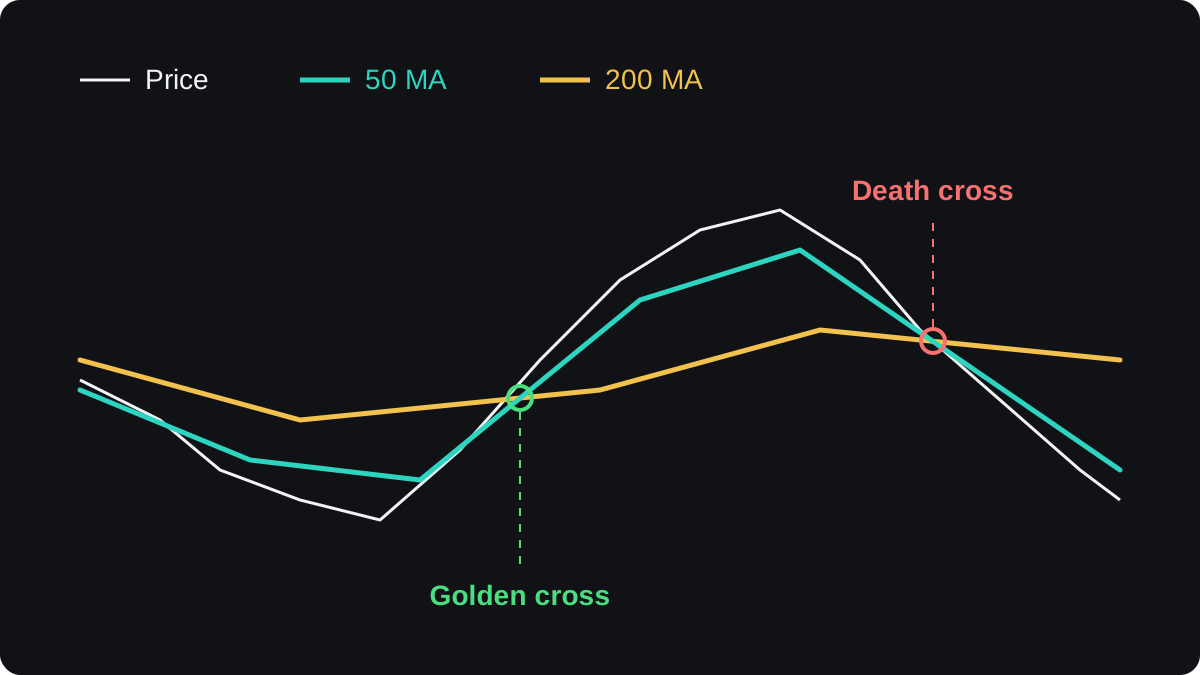
Both lines lag, so a cross often arrives after much of the move is over. In a range the lines tangle and cross back and forth, and each false signal you act on still costs the spread.
Published tests of crossover rules give mixed results that vary with the market and period, and costs reduce them further. Treat a cross as one piece of evidence. The crossover lesson goes deeper.
How do traders use a moving average as support or resistance?
In an uptrend, pullbacks often pause near a widely watched average. Traders call this dynamic support, a level that moves with every bar. In a downtrend it becomes dynamic resistance.
Read the average as a zone. Price often pokes a few pips through it, so traders usually wait for a candle to close beyond the zone before calling the level broken.
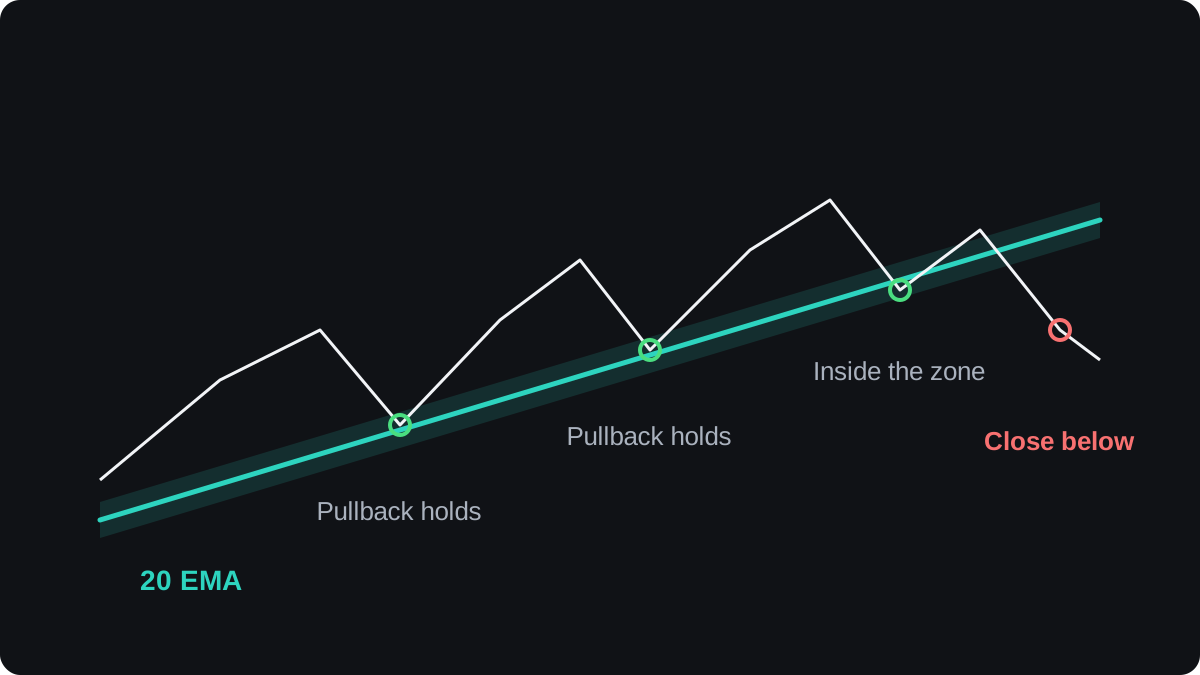
Nothing in the maths makes price respect the line. Any reaction comes from the trend and from traders watching the same level. The dynamic support lesson goes further.
The next lesson, Bollinger Bands, draws bands around a 20-period SMA.
Pertanyaan
What is the best moving average setting?
No setting is best everywhere. Lengths of 20, 50 and 200 are popular conventions, so test any choice on past data and a demo account first.
Is the EMA better than the SMA?
Neither is better in general. The EMA reacts faster and tends to give more false signals in choppy markets, while the SMA is slower and smoother.
What is a golden cross?
It is the 50-period average crossing above the 200-period one, usually on a daily chart. It lags, often by much of the move.
Do moving averages work in forex?
They show trend direction clearly while a market trends. They lag price, give false signals in ranges and guarantee no profit.
Which price does a moving average use?
Most platforms use the closing price by default. MetaTrader lets you pick another price, such as the open, high or low, in the indicator settings.
Lanjut belajar
 Bab 4What is a moving average?A moving average is the average closing price over a set number of recent candles, recalculated every time a new candle closes. Plotted as a line, it smooths out small price swings so the direction of the trend is easier to see. Because it is built from past prices, it always lags behind the market.
 Bab 4Simple moving average (SMA).A simple moving average (SMA) adds the closing prices of the last N candles and divides by N. Each new candle adds one price and drops the oldest, so the line rolls forward. Every price carries equal weight, so one unusually large close lifts the average and moves it again when it drops out.
 Bab 4Exponential moving average (EMA).An exponential moving average (EMA) is an average of past prices that gives the latest close the most weight. Each period it moves part of the way toward the new price, by a share set by k = 2 ÷ (N + 1). It turns sooner than a simple moving average, but it still lags and gives false signals in sideways markets.
 Bab 4SMA or EMA: which should you use?An SMA gives every price in its window the same weight, so it is smooth but slow to turn. An EMA gives the newest prices more weight, so it turns sooner but reacts more to noise. Neither is better in general: choose by the job and test it on your own charts.
 Bab 4Using moving averages to read the trend.A moving average gives two trend readings. Price above the line means the latest close is higher than the average, and price below means lower. The line's slope shows whether the average itself is rising or falling. When both point the same way, the trend reading is clear; when they disagree, it is mixed.
 Bab 4Moving average crossovers.A moving average crossover is the moment a fast moving average crosses a slow one. A cross above is read as a buy signal and a cross below as a sell signal. Because both lines are built from past prices, the signal always comes after the turn, and sideways markets produce repeated false crosses.
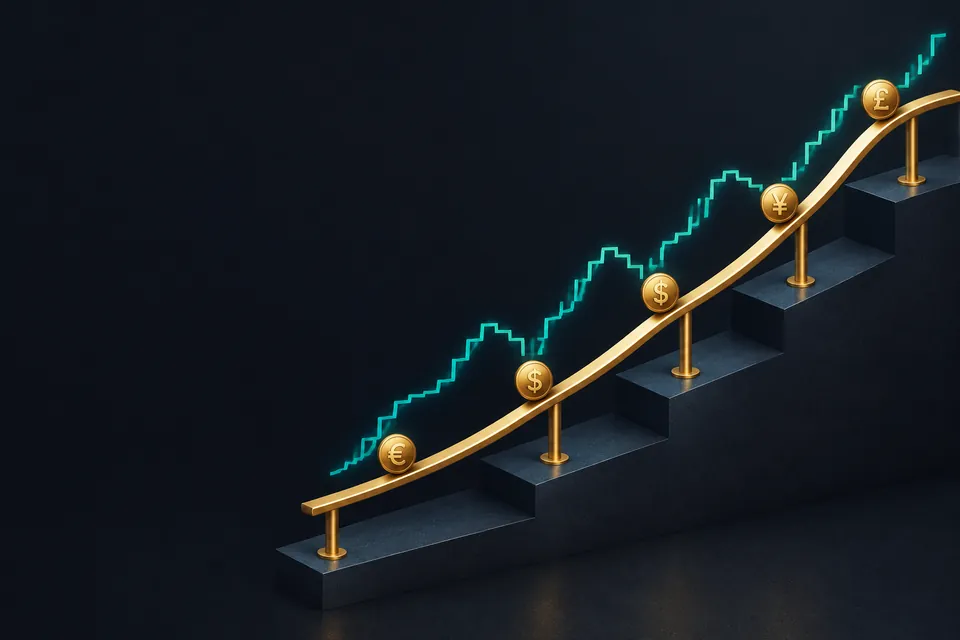 Bab 4Moving averages as dynamic support and resistance.Dynamic support is a moving average that sits below price in an uptrend and keeps rising with it, so pullbacks sometimes pause near the line. Dynamic resistance is the same idea above price in a downtrend. Treat the line as a rough zone. It is most useful in clear trends and often fails in ranges.

