SMA or EMA: which should you use?
An SMA gives every price in its window the same weight, so it is smooth but slow to turn. An EMA gives the newest prices more weight, so it turns sooner but reacts more to noise. Neither is better in general: choose by the job and test it on your own charts.
Konten ini baru tersedia dalam bahasa Inggris.
Put a 20-period simple moving average and a 20-period exponential moving average on the same chart and they mostly travel together. They separate when price turns sharply. The EMA bends first and the SMA follows a few candles later.
Neither line is better in every case. Both average recent prices, and they differ only in how they share out the weight.
That one difference decides how smooth and how fast each line is. For a refresher, see what a moving average is.
How do the two averages weigh each price?
A 5-period simple moving average adds the last five closes and divides by five. Each close carries 20% of the weight. When a new candle closes, the oldest of the five drops out completely.
A 5-period exponential moving average uses a multiplier of 2 ÷ (5 + 1), which is one third. The newest close gets one third of the weight, the close before it gets one third of what is left, and so on back.
Worked out, the EMA gives 33.3%, 22.2%, 14.8%, 9.9% and 6.6% to the last five closes. That adds up to 86.8%. The other 13.2% is spread across every older close, shrinking with age and never quite reaching zero.
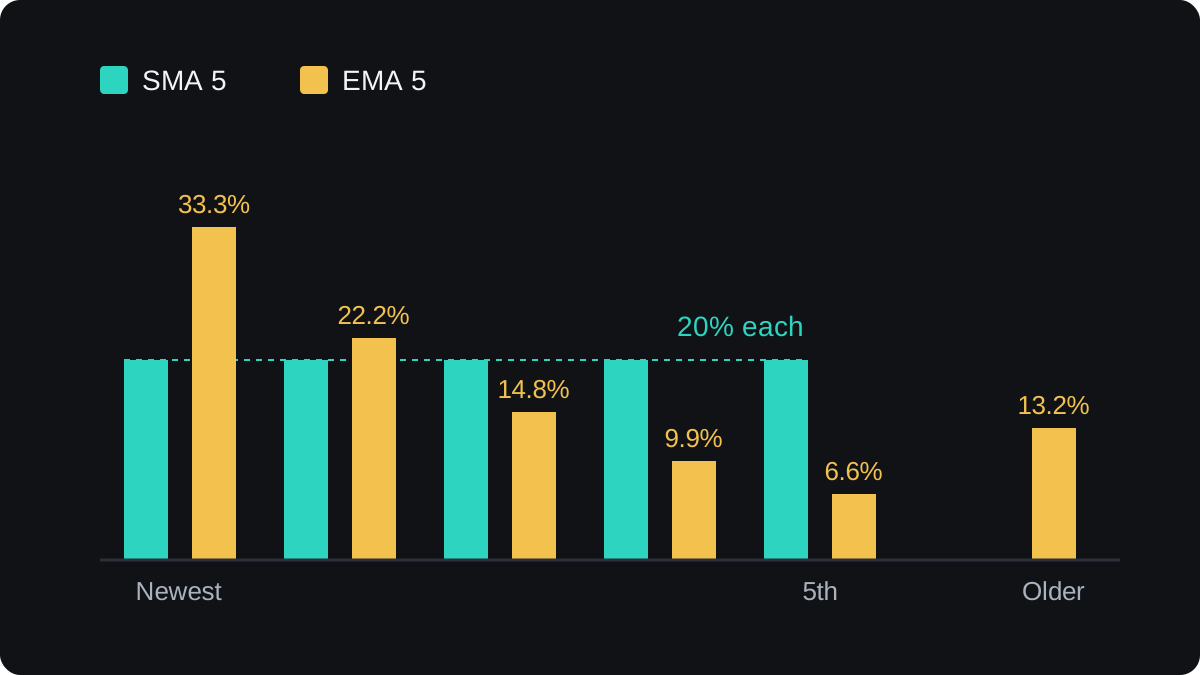
Both lines have the same average age of data. For the 5 SMA it is (0 + 1 + 2 + 3 + 4) ÷ 5 = 2 candles, and with the 2 ÷ (N + 1) multiplier the 5 EMA also averages 2 candles.
In that sense the two lines lag by the same amount. What changes is the shape: the EMA puts more weight on the newest close and keeps a long, thin tail of old ones.
Which line reacts first when price jumps?
Take round illustrative EUR/USD closes: 1.10000 for five candles, then a jump to 1.10600 that holds. A pip on this pair is 0.0001, so the jump is 60 pips.
On candle 5, after the flat run, both 5-period averages sit at 1.10000.
- SMA on candle 6: (4 × 1.10000 + 1.10600) ÷ 5 = 5.50600 ÷ 5 = 1.10120. That is 12 pips up.
- EMA on candle 6: 1.10000 + (1.10600 − 1.10000) ÷ 3 = 1.10000 + 0.00200 = 1.10200. That is 20 pips up.
- EMA on candle 7: 1.10200 + (1.10600 − 1.10200) ÷ 3 = 1.10200 + 0.00133 = 1.10333.
- From there the EMA closes one third of the remaining gap each candle, and the SMA climbs a steady 12 pips per candle.
| Candle | Close | 5 SMA | 5 EMA |
|---|---|---|---|
| 5 | 1.10000 | 1.10000 | 1.10000 |
| 6 | 1.10600 | 1.10120 | 1.10200 |
| 7 | 1.10600 | 1.10240 | 1.10333 |
| 8 | 1.10600 | 1.10360 | 1.10422 |
| 9 | 1.10600 | 1.10480 | 1.10481 |
| 10 | 1.10600 | 1.10600 | 1.10521 |
After one candle the EMA has covered 20 of the 60 pips and the SMA 12. By candle 9 they are level at about 48 pips.
On candle 10 all five closes in the SMA are new prices, so it sits exactly at 1.10600. The EMA is at 1.10521, still 7.9 pips short, and keeps creeping closer.
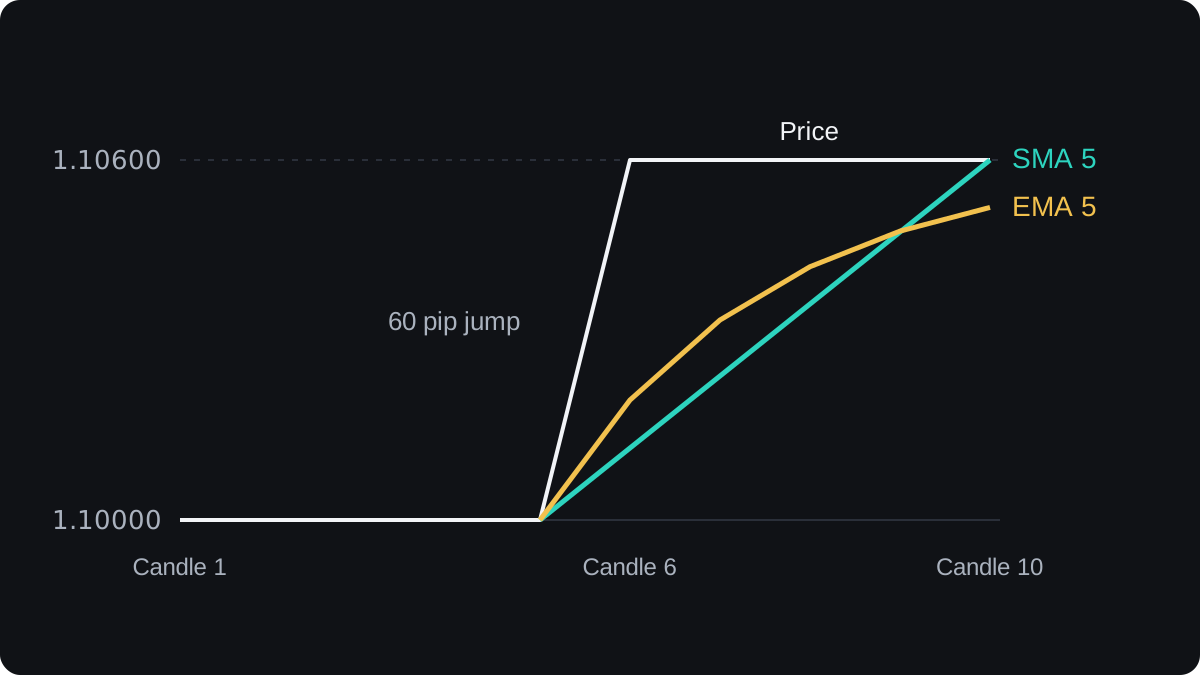
Faster therefore means only that the EMA starts moving sooner. On a clean, lasting jump the SMA reaches the new level first, because its old prices leave the window all at once.
Why can an SMA move when price stands still?
Now take a single spike. EUR/USD closes at 1.10000, prints one close at 1.11000 on candle 6, 100 pips higher, and goes straight back to 1.10000.
The 5 SMA rises to (4 × 1.10000 + 1.11000) ÷ 5 = 1.10200 and stays there for five candles. On candle 11 the spike leaves the window and the SMA drops 20 pips to 1.10000, although price has been flat since candle 7.
The 5 EMA jumps further on the spike itself, to 1.10333. After that it gives back one third of its distance each candle: 1.10222, 1.10148, 1.10099, 1.10066, 1.10044. It never makes a sudden move of its own.
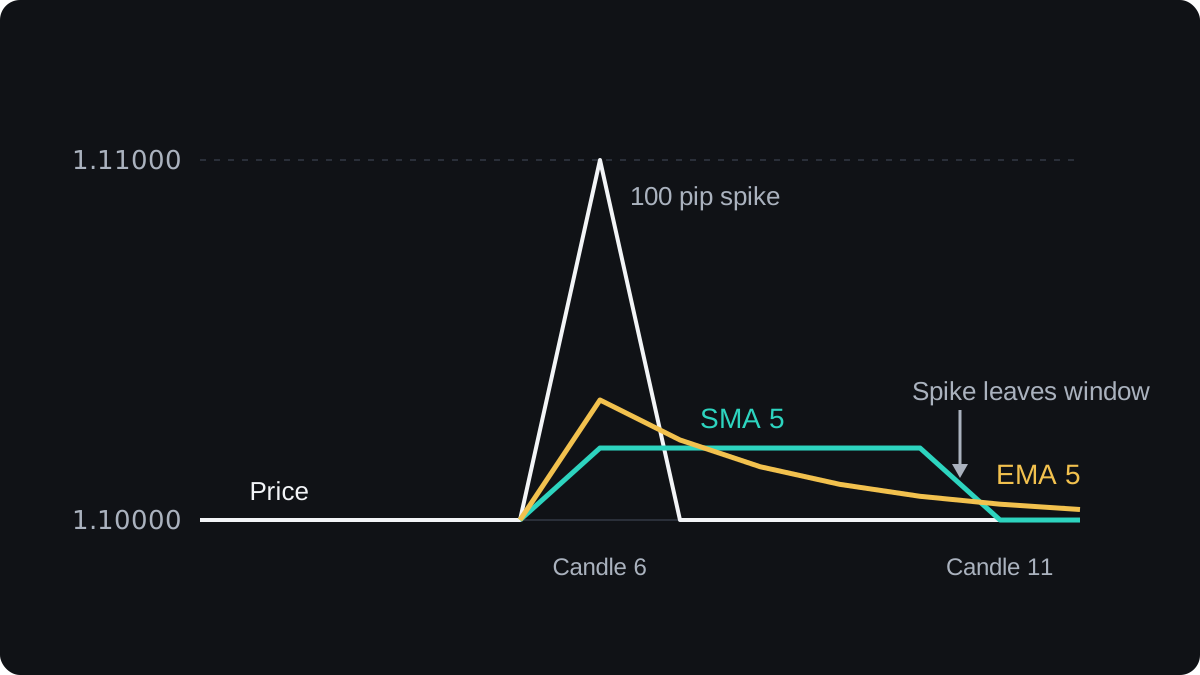
This is sometimes called the drop-off effect. If an SMA turns on a quiet day, check what price did one full period ago before you read the turn as a new signal.
What does a faster line cost you?
A line that reacts sooner also reacts more to noise. In a sideways market, a fast average crosses price again and again, and each cross can look like a signal that goes nowhere.
The lesson on trending versus ranging markets shows why this hurts most when price has no direction.
A smoother line ignores more of that noise. The price you pay is that it turns later when a real trend begins, so any signal built on it arrives after more of the move has gone.
This trade-off exists inside each type too. You can speed up an SMA by shortening it, or slow down an EMA by lengthening it.
Length usually changes a line far more than type does. On most charts a 20 EMA sits much closer to a 20 SMA than a 20 SMA sits to a 50 SMA.
The same balance shows up in moving average crossovers. With the same lengths, EMA crossovers usually come a little earlier than SMA crossovers, which brings earlier entries along with earlier false alarms.
How do you choose between them?
Start from the job you want the line to do.
- For a slow reference of trend direction, smoothness matters more than speed, and the steady weighting of an SMA suits that. Long SMAs such as the 200-day are often quoted in market commentary on daily charts.
- For tracking short swings or trailing an exit, a quicker response matters more, and an EMA turns sooner after a change.
- For comparing your chart with someone else's, match the type, the length and the price used, which is usually the close. Platforms also start an EMA in slightly different ways, so early values can differ.
The evidence is thin either way. No solid proof shows that either type gives better trading results across pairs and timeframes.
A setting that looked good on one pair over one period may do worse on the next, so test your choice with backtesting before you trust it.
Once you choose, keep it. Swapping SMA for EMA after a losing trade changes your rules without testing them. The next lesson shows how to read the trend with moving averages, whichever type you pick.
Pertanyaan
Is EMA better than SMA for day trading?
Neither is better in general. An EMA turns sooner, which suits short holding times, and it also gives more false signals in choppy markets. Test both on the pairs and timeframe you trade.
Does a 20 EMA have less lag than a 20 SMA?
It reacts to the newest close more strongly, so it starts turning sooner after a change. Measured as the average age of its prices, both lines lag by (20 − 1) ÷ 2 = 9.5 candles.
Why is my EMA different from the one on another platform?
An EMA depends on every past price and on its starting value, and platforms start it in different ways. Check that the length and the price used match, and load more history so the starting value matters less.
What length should I use for an SMA or EMA?
No length is correct for every market. Shorter lines react faster and give more false signals, longer ones are smoother and later, and the length you pick changes the line more than the choice of SMA or EMA.
Lanjut belajar
 Bab 4What is a moving average?A moving average is the average closing price over a set number of recent candles, recalculated every time a new candle closes. Plotted as a line, it smooths out small price swings so the direction of the trend is easier to see. Because it is built from past prices, it always lags behind the market.
 Bab 4Simple moving average (SMA).A simple moving average (SMA) adds the closing prices of the last N candles and divides by N. Each new candle adds one price and drops the oldest, so the line rolls forward. Every price carries equal weight, so one unusually large close lifts the average and moves it again when it drops out.
 Bab 4Exponential moving average (EMA).An exponential moving average (EMA) is an average of past prices that gives the latest close the most weight. Each period it moves part of the way toward the new price, by a share set by k = 2 ÷ (N + 1). It turns sooner than a simple moving average, but it still lags and gives false signals in sideways markets.
 Bab 4Using moving averages to read the trend.A moving average gives two trend readings. Price above the line means the latest close is higher than the average, and price below means lower. The line's slope shows whether the average itself is rising or falling. When both point the same way, the trend reading is clear; when they disagree, it is mixed.
 Bab 4Moving average crossovers.A moving average crossover is the moment a fast moving average crosses a slow one. A cross above is read as a buy signal and a cross below as a sell signal. Because both lines are built from past prices, the signal always comes after the turn, and sideways markets produce repeated false crosses.
 Bab 4Moving averages as dynamic support and resistance.Dynamic support is a moving average that sits below price in an uptrend and keeps rising with it, so pullbacks sometimes pause near the line. Dynamic resistance is the same idea above price in a downtrend. Treat the line as a rough zone. It is most useful in clear trends and often fails in ranges.
 Bab 4Moving averages cheat sheet.A moving average is the average of recent closing prices, recalculated on every new bar. The SMA weights the last N closes equally, and the EMA weights recent closes more, so it reacts faster. Traders use the slope for trend, fast and slow crossovers as signals and the line as moving support or resistance, and every version lags price.

