How much to risk per trade.
Risk per trade is the money you lose if a trade hits its stop loss. The fixed-percentage rule sets it as a share of your current balance, commonly 1% to 2%, so each loss shrinks the next bet. At 1%, ten losses in a row take a $10,000 account to about $9,044.
Konten ini baru tersedia dalam bahasa Inggris.
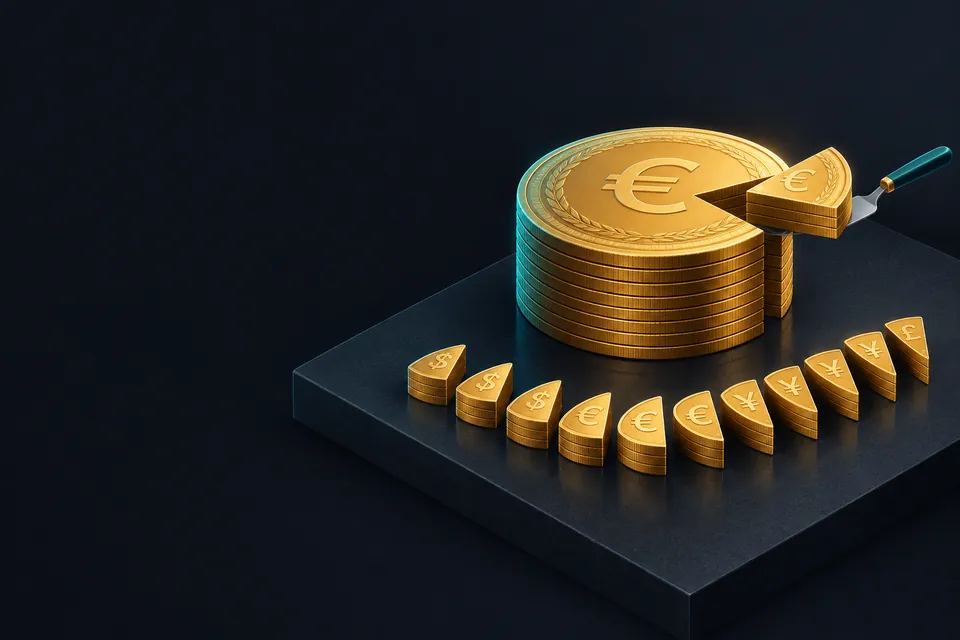
Two traders open accounts with $10,000 each. One risks $1,000 on every trade and the other risks $100. Then both hit five losing trades in a row, a run that any strategy can produce.
The first trader is down $5,000 and needs a 100% gain to get back to the start. The second is down $500 and needs about 5.3%. The size of each bet decided that gap before either trade was placed.
What does risk per trade mean?
Risk per trade is the money you lose if a trade hits its stop loss. You fix it before entering, by choosing where the stop goes and how large the position is.
It is a separate number from margin, the deposit your broker holds while a trade is open. Two trades can tie up the same margin and risk very different amounts, because their stop distances differ.
Three inputs set the figure:
Risk = stop distance in pips × pip value per lot × lots
A trade with no stop has no planned limit short of your whole balance, so this lesson assumes every trade has one. The stop loss lesson explains why.
How the fixed-percentage rule works
With the fixed-percentage rule, you risk the same share of your current balance on every trade. At 1% of $10,000, that is $100. If the balance later falls to $9,000, 1% becomes $90.
The bet shrinks after losses and grows after wins without any extra decision. A fixed dollar amount does neither: $100 is 1% of $10,000 but 2% of $5,000.
Figures of 1% to 2% per trade are a common convention in trading education. They are rules of thumb, and no single figure suits every trader or strategy.
What a losing streak does at different risk levels
Streaks of losses are normal, even for a strategy that makes money over time. If a strategy wins 40% of its trades and each trade is independent, any given run of 10 trades has about a 1 in 165 chance of being all losers.
Over hundreds of trades you pass through many such runs, so a long streak is something to plan for.
The table applies each loss to the balance left after the one before. It starts from $10,000 and rounds to the nearest dollar.
| Risk per trade | After 5 losses | After 10 losses | After 20 losses |
|---|---|---|---|
| 1% | $9,510 | $9,044 | $8,179 |
| 2% | $9,039 | $8,171 | $6,676 |
| 5% | $7,738 | $5,987 | $3,585 |
| 10% | $5,905 | $3,487 | $1,216 |
After 10 losses at 1%, you still hold $9,044. At 10% per trade, the same streak leaves $3,487, about a third of where you started.
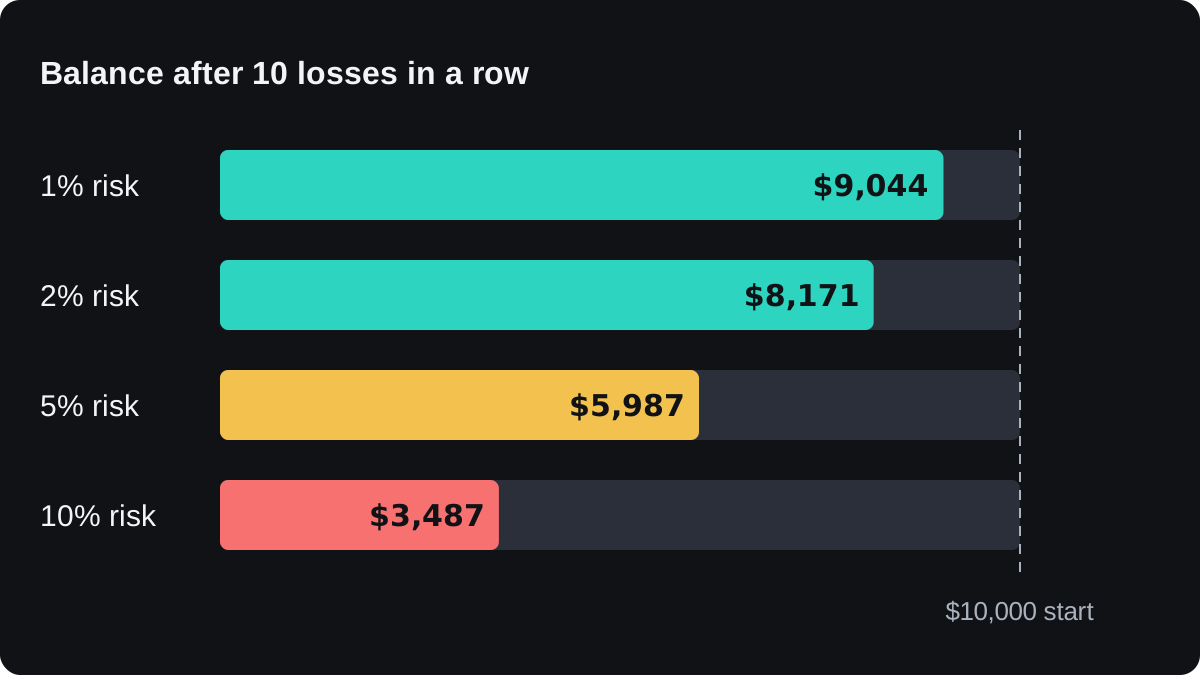
Recovery widens the gap. As the drawdown lesson showed, a smaller balance needs a bigger percentage gain to climb back. From $9,044 you need about 10.6% to reach $10,000, and from $3,487 you need about 186.8%.
In theory a fixed percentage never empties the account, because each loss takes a share of what is left. In practice the smallest position your broker allows puts a floor on how small the bet can get.
How do you turn 1% into a lot size?
Here is a full example with round illustrative prices, in a US dollar account.
- Your balance is $10,000, so 1% risk is $100.
- You plan to buy EUR/USD at 1.10500 with a stop at 1.10250.
- The distance is 1.10500 minus 1.10250 = 0.00250, which is 25 pips.
- On EUR/USD, one pip on one standard lot is worth $10.
- Lots = $100 ÷ (25 × $10) = $100 ÷ $250 = 0.40 lot.
- Check: at 0.40 lot a pip is worth $4, and 25 × $4 = $100.
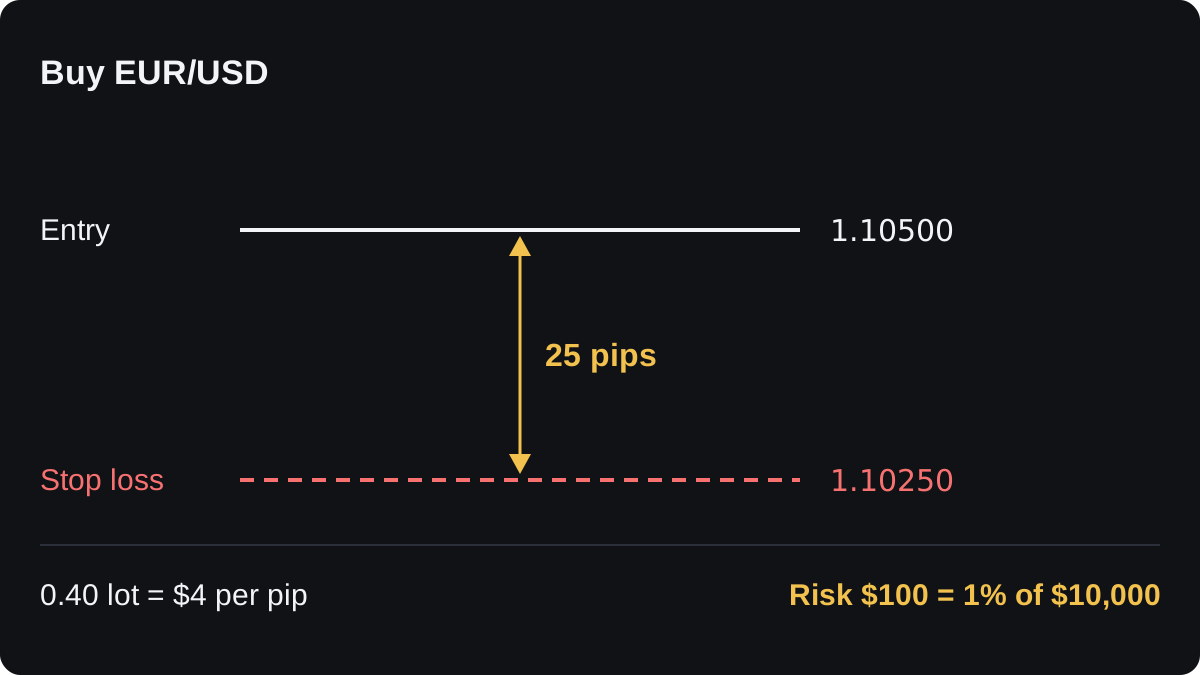
You placed the stop where the trade idea is proven wrong, then sized the position to fit it. The stop decides the size, never the other way round.
A wider stop means a smaller position. With a 50 pip stop, the same $100 allows $100 ÷ (50 × $10) = 0.20 lot.
Yen pairs need one more step, because the pip value is in yen. On USD/JPY at 150.00, one pip on one lot is 1,000 yen, or 1,000 ÷ 150.00 = $6.67.
With a 40 pip stop, $100 ÷ (40 × $6.67) is about 0.375 lot, which you round down to 0.37 lot. That position risks 0.37 × 1,000 × 40 = 14,800 yen, which is $98.67 at 150.00.
Round down rather than up, so the loss stays at or under your limit. The lot size calculator does this sum for any pair, and how to calculate position size covers more cases.
After every closed trade, start again from the new balance. If the EUR/USD trade loses, you hold $9,900, 1% is $99, and the same 25 pip stop gives 0.396 lot, rounded down to 0.39 lot.
Where the fixed-percentage rule falls short
A stop loss is an order, and the fill can be worse than the price you set. Fast markets and weekend gaps can close a trade beyond its stop through slippage, so a planned 1% loss can turn out larger.
Correlated trades add up. Buying EUR/USD, GBP/USD and AUD/USD at 1% each puts three bets on one idea, a weaker US dollar. If the dollar rises sharply, all three can lose together.
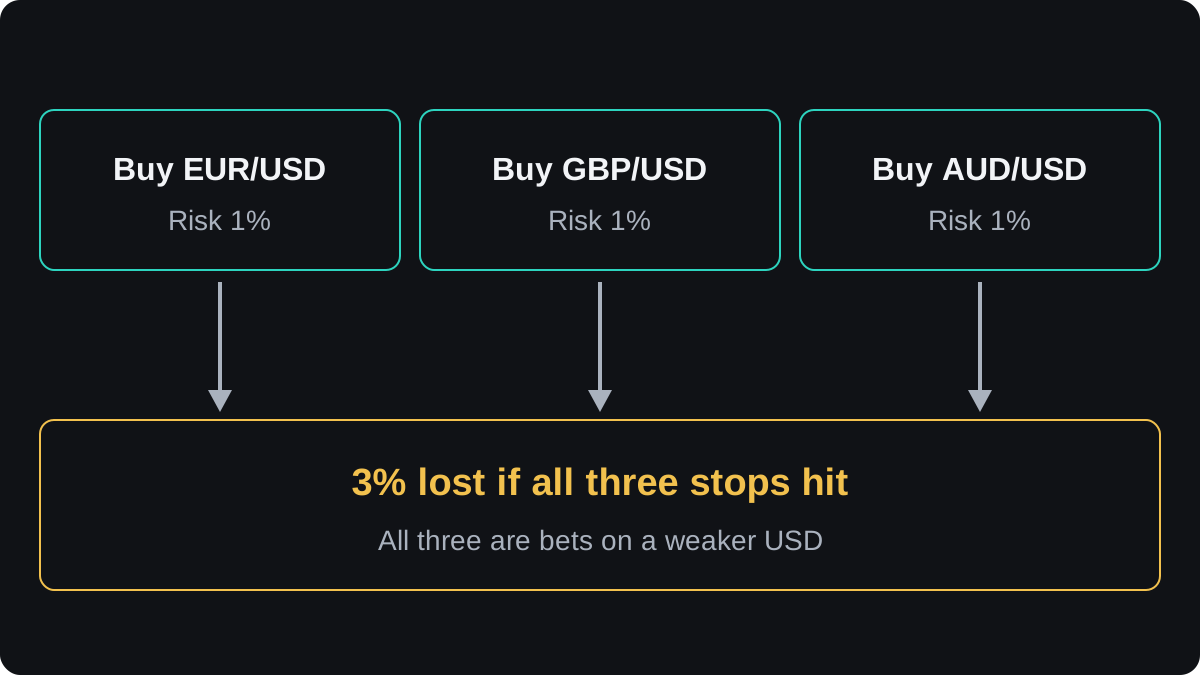
Setting a limit on total open risk, such as 3% across all positions, is one way to handle this. The lesson on correlation and portfolio risk goes further.
Small accounts run into the minimum trade size. Many brokers set it at 0.01 lot, worth $0.10 per pip on EUR/USD.
On a $200 account, 1% is $2, so at 0.01 lot the stop can sit at most $2 ÷ $0.10 = 20 pips away. Any wider stop risks more than 1%.
The rule controls how fast losses arrive. A strategy that loses money over time will still lose it, only more slowly.
Whether a strategy can earn depends on its win rate and the size of its wins against its losses, the subject of risk-reward ratio and win rate.
Pertanyaan
Is 1% or 2% risk per trade better?
Neither is proven better for every trader. After 20 losses in a row from $10,000, 1% leaves $8,179 and 2% leaves $6,676, so the lower figure gives more room to survive a long streak.
Should I risk less after a losing trade?
Under the fixed-percentage rule this happens on its own, because you recompute from the current balance. At 1%, a balance of $9,900 means $99 of risk on the next trade.
Can I lose more than my risk per trade?
Yes. Gaps and slippage can fill a stop beyond its price, and commission adds to the loss, so the planned figure can be exceeded.
How do I work out lot size from a risk percentage?
Divide the money at risk by the stop distance in pips times the pip value per lot. For $10,000 at 1% with a 25 pip stop on EUR/USD, that is $100 ÷ $250 = 0.40 lot.
Lanjut belajar
 Bab 1What is risk management in trading?Risk management is the set of rules, decided before you place an order, that limits how much you can lose on one trade and in total. It covers risk per trade, stop placement, position size and total exposure. Its job is keeping you trading through losing streaks, because no method wins every trade.
 Bab 1Drawdown and the maths of recovery.A drawdown is the fall in your account from its highest point to a later low, shown as a percentage. Losses and gains are not symmetric: after losing 50% you need a 100% gain to break even, because the gain is earned on a smaller balance. The gain needed is the loss divided by one minus the loss.
 Bab 1Risk-reward ratio and win rate.The risk-reward ratio compares what a trade can lose with what it aims to win, and the win rate is the share of trades that win. Together they decide whether a strategy pays. The win rate you need to break even is risk divided by risk plus reward, so a 1:2 trade needs 33.3% before costs.

