The three-drives pattern.
The three-drives pattern is three pushes in the same direction, each separated by a pullback, with the drives and pullbacks close in size. After a rise it shows three higher highs and hints at a turn down; after a fall, three lower lows hint at a turn up. It signals possible exhaustion, never a guaranteed reversal.
Konten ini baru tersedia dalam bahasa Inggris.

Picture a rise in three steps. Price climbs to a new high, pulls back, climbs to a higher high, pulls back again, then makes a third high. The pushes are about the same size, and so are the pullbacks.
That shape is the three-drives pattern. It belongs to the harmonic family, and it grows directly out of the ABCD pattern from the previous lesson.
What does a three-drives pattern look like?
A drive is one push in the direction of the trend. A three-drives pattern is three drives in a row with two corrections between them, where the drives are close in size and the corrections are close in depth.
A bearish three drives forms after a rise. It shows three higher highs and points to a possible turn down.
A bullish three drives is the mirror image after a fall. It shows three lower lows and points to a possible turn up.
Drive 1, the correction after it and drive 2 together form an ABCD shape. Drive 2, the second correction and drive 3 form another, so the pattern is two ABCDs that share the middle drive.
The reasoning behind it is exhaustion. The trend keeps making new extremes, yet each push is no larger than the last, and traders read that as a move losing energy.
That is an interpretation of the shape, and the shape alone cannot confirm it.
Which ratios define the three drives?
Harmonic traders check the pattern with Fibonacci ratios. A common guideline has two parts:
- Each correction retraces about 0.618 (61.8%) of the drive before it. The Fibonacci retracement lesson explains how that is measured.
- Drives 2 and 3 each travel about 1.272 or 1.618 times the length of the correction before them, a Fibonacci extension.
The two extension choices give different shapes, and a little multiplication shows why. Take a first drive of 100 pips, so the correction after it is about 62 pips.
With 1.618, the next drive is 0.618 × 1.618 = 1.0 times the first. The drives come out equal, which is the symmetrical version of the pattern.
With 1.272, the next drive is 0.618 × 1.272 = 0.786 times the one before, so the pushes shrink. From 100 pips, drive 2 is about 79 pips and drive 3 about 62 pips.
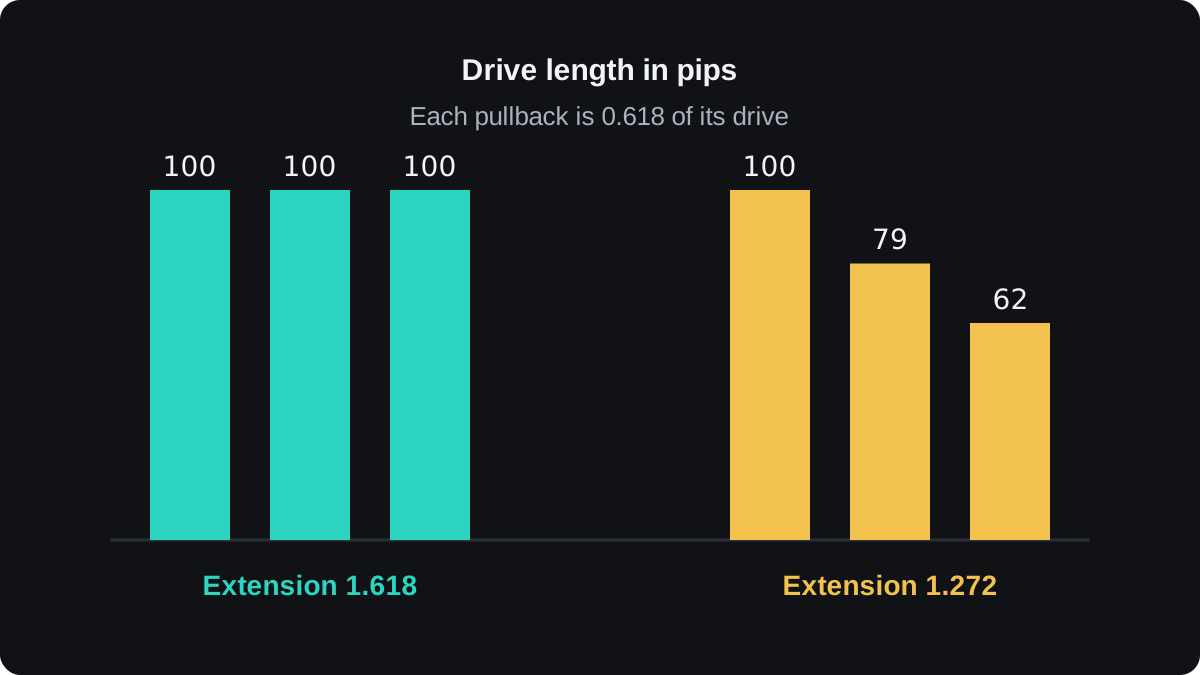
Sources on harmonic patterns do not all use the same ratios, and real charts never land on them exactly. Traders allow a tolerance around each number, and how wide you set it changes how many patterns you find.
Some traders also look for symmetry in time, with each drive taking a similar number of candles. A drive that takes three times as long as the others weakens the case.
How do you check the pattern on a chart?
Here is a bearish three drives on EUR/USD with round illustrative prices. A pip on this pair is 0.0001.
- Drive 1 rises from 1.08000 to 1.09000. That is 0.01000, or 100 pips.
- Correction 1 falls to 1.08380, a drop of 62 pips. 62 ÷ 100 = 0.62, close to 0.618.
- Drive 2 rises to 1.09380, a gain of 100 pips. 100 ÷ 62 = 1.61, close to 1.618.
- Correction 2 falls to 1.08760, again 62 pips, or 0.62 of drive 2.
- Drive 3 rises to 1.09760, again 100 pips, or 1.61 times correction 2.
Each high sits 38 pips above the one before: 1.09380 − 1.09000 = 0.00380, and 1.09760 − 1.09380 = 0.00380. When the drives also take equal time, the three highs fall on one straight line.
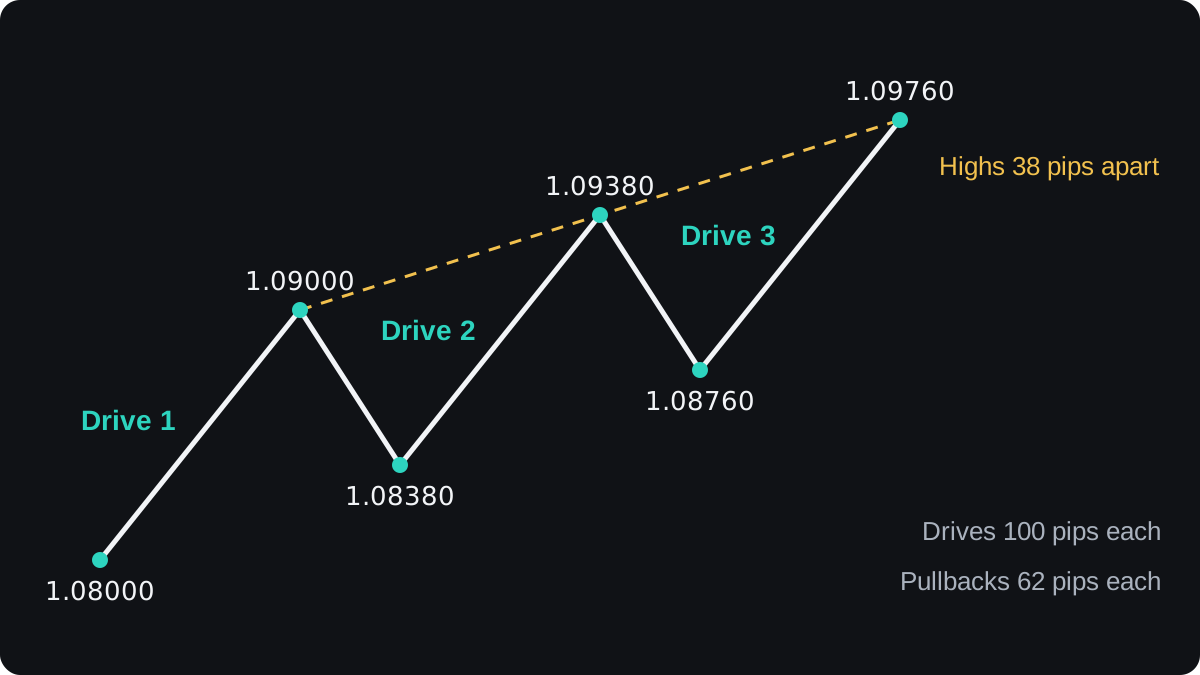
A close fit to the ratios only describes the shape. Whether price turns at drive 3 is a separate question that the measurements cannot answer.
The Fibonacci calculator gives retracement and extension levels from any two prices, which saves doing these sums by hand.
How might a trader plan a trade on it?
The plan below is an illustrative example of the mechanics. It is not a signal to trade.
A common approach is to wait for drive 3 to finish and for some sign of a turn. That might be a bearish candle, or divergence, where RSI makes a lower high while price makes a higher high.
- Sell when price slips back to 1.09700, below the drive 3 high of 1.09760.
- Place the stop loss at 1.09900, above that high. Risk is 1.09900 − 1.09700 = 0.00200, or 20 pips.
- Aim for 1.08760, the low where drive 3 began. That is 1.09700 − 1.08760 = 0.00940, or 94 pips.
- Size the trade. On a $2,000 account with 1% risk, you can lose $20, so $20 ÷ 20 pips = $1 per pip.
- On EUR/USD, $1 per pip is 0.10 lot, because 10,000 euros × 0.0001 = $1.
- If the stop is hit, the loss is 20 × $1 = $20. If the target is hit, the gain is 94 × $1 = $94, before spread and any commission.
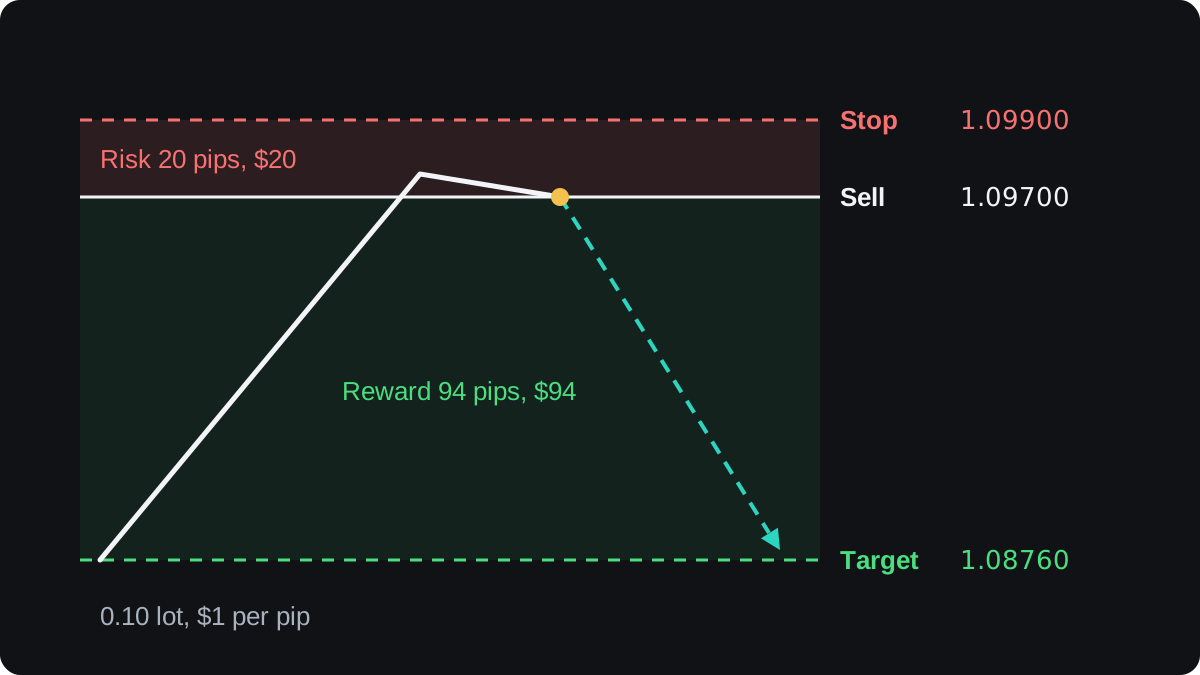
The position size lesson covers step 4 in more detail.
A reward of 94 pips against a risk of 20 looks good on paper. The ratio says nothing about how often price reaches the target, and a distant target is usually hit less often than a near one.
Where does the three-drives pattern fail?
The plainest failure is a fourth drive. A strong trend can make many higher highs in a row, and nothing in the pattern tells you which push is the last.
When a fourth drive comes, the stop above drive 3 limits the loss to about the planned 20 pips, plus any slippage.
Finding the pattern is subjective. Two traders can pick different swing points on the same chart, and a wide tolerance makes three drives appear almost everywhere.
Past charts make the pattern look better than it is. In hindsight you notice the patterns that turned and skip the ones that kept going. Marking each pattern before you know the outcome reduces that bias.
The evidence is thin. There is little independent, published testing of the three-drives pattern, and the idea that markets respect Fibonacci ratios is itself disputed.
If you want to use it, backtest it with fixed rules on your own data first.
Scheduled news can also override any shape. An interest rate decision or a jobs report can push price straight through the drive 3 high.
The next lesson, on the Gartley pattern, moves to a five-point shape with more ratio rules.
Pertanyaan
Is the three-drives pattern reliable?
No chart pattern is reliable on its own. There is little independent, published testing of this one, so treat it as a way to frame a trade and test it on your own data before risking money.
How is the three-drives pattern different from the ABCD pattern?
An ABCD has two drives and one correction. Three drives adds a second correction and a third drive, so it is two ABCD shapes that share the middle drive.
What is a bullish three-drives pattern?
It is the mirror image: three lower lows after a fall, with pullbacks of similar size between them. Traders read it as a possible turn up, with a stop below the third low.
Which timeframe is the three-drives pattern used on?
The geometry is the same on any timeframe. Shorter charts show more patterns, but small swings are noisier and the spread takes a bigger share of each move.
Lanjut belajar
 Bab 3The ABCD pattern.The ABCD pattern is a four-point price shape with two moves in the same direction, AB and CD, split by a pullback, BC. In the classic form, BC retraces 61.8% to 78.6% of AB, and CD matches AB in length. Point D marks a zone where some traders expect a reversal, though the evidence for it is weak.
 Bab 3The Gartley pattern.The Gartley pattern is a five-point price shape, X, A, B, C and D, measured with Fibonacci ratios. B retraces 61.8% of the first leg, XA, and the pattern completes at D, near a 78.6% retracement of XA. Traders watch D for a possible reversal, but the rules vary and evidence for the pattern is weak.
 Bab 3Crab and butterfly patterns.Crab and butterfly patterns are harmonic patterns whose final point, D, lands beyond the starting point X. In a butterfly, D sits at about 1.27 times the XA leg from A. In a crab it sits at about 1.618. Traders watch D as a possible turning zone, but the ratios are conventions with limited evidence.

