What is currency correlation?
Currency correlation measures how closely two currency pairs move together. It is expressed as a correlation coefficient from -1 to +1. A value near +1 means the pairs tend to move in the same direction, near -1 means they tend to move in opposite directions, and near 0 means there is little linear link.
Konten ini baru tersedia dalam bahasa Inggris.

Line up a chart of EUR/USD next to one of GBP/USD and you will often see them rise and fall on the same days. Put EUR/USD next to USD/CHF and the picture tends to flip.
Currency correlation is the measure of that relationship. It turns how closely two currency pairs move together into a single number you can compare.
What does it mean when two pairs are correlated?
Two pairs are positively correlated when they tend to move in the same direction over the same period. When one rises, the other usually rises too.
Two pairs are negatively correlated when they tend to move in opposite directions. When one rises, the other usually falls.
Usually is the important word here. Correlation describes a tendency across many days or hours, and any single day can break it.
The size of the moves can differ. If EUR/USD rises 50 pips and GBP/USD rises 20 on the same day, that day still adds to a positive correlation.
How do you read the correlation coefficient?
The number is the correlation coefficient, usually written r. It always sits between -1 and +1.
At +1 the two pairs move in perfect step: every move in one is matched by a move in the same direction, in a fixed proportion. At -1 the match is just as perfect, in opposite directions.
At 0 there is no straight-line link. A rule such as when one rises, the other rises would not help you guess the second pair, although some other kind of pattern could still exist.
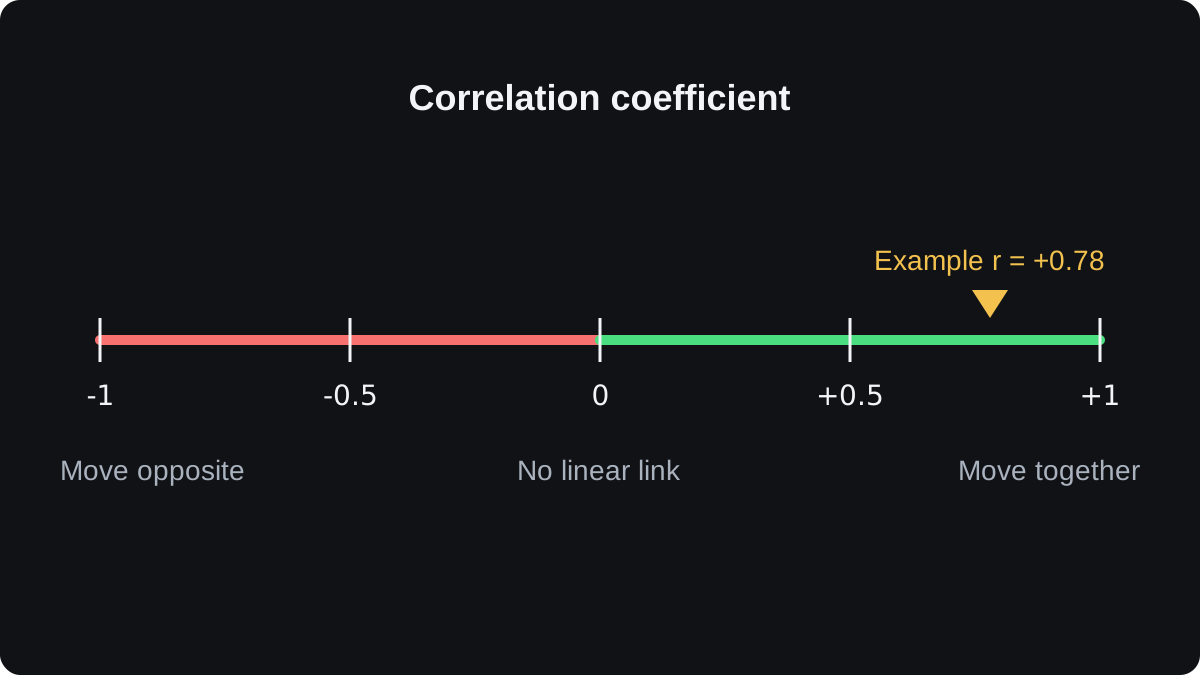
Real pairs land somewhere in between. This course uses a simple reading guide, a convention rather than an official standard: beyond +0.7 or -0.7 is strong, between -0.3 and +0.3 is weak, and the rest is moderate.
The sign gives the direction and the size gives the strength. A reading of -0.8 is as strong a link as +0.8, only the other way round.
How is correlation calculated?
You rarely need to work it out by hand, but doing it once shows what the number means. Here are five days of price changes, invented for this example and counted in pips.
| Day | EUR/USD (pips) | GBP/USD (pips) | Product |
|---|---|---|---|
| 1 | +30 | +20 | 600 |
| 2 | -10 | -10 | 100 |
| 3 | +20 | 0 | 0 |
| 4 | -20 | -10 | 200 |
| 5 | -20 | 0 | 0 |
| Sum | 0 | 0 | 900 |
The product column multiplies the two changes for each day. A positive product means the pairs moved the same way that day, and a negative product means they moved apart.
- Find each pair's average daily change. Both columns add up to 0, so both averages are 0. Real data rarely does this, and you would subtract the average from each day first.
- Add the daily products: 600 + 100 + 0 + 200 + 0 = 900.
- Square each EUR/USD change and add them: 900 + 100 + 400 + 400 + 400 = 2,200.
- Square each GBP/USD change and add them: 400 + 100 + 0 + 100 + 0 = 600.
- Multiply those two totals and take the square root: √(2,200 × 600) = √1,320,000 ≈ 1,148.9.
- Divide step 2 by step 5: 900 ÷ 1,148.9 ≈ 0.78.
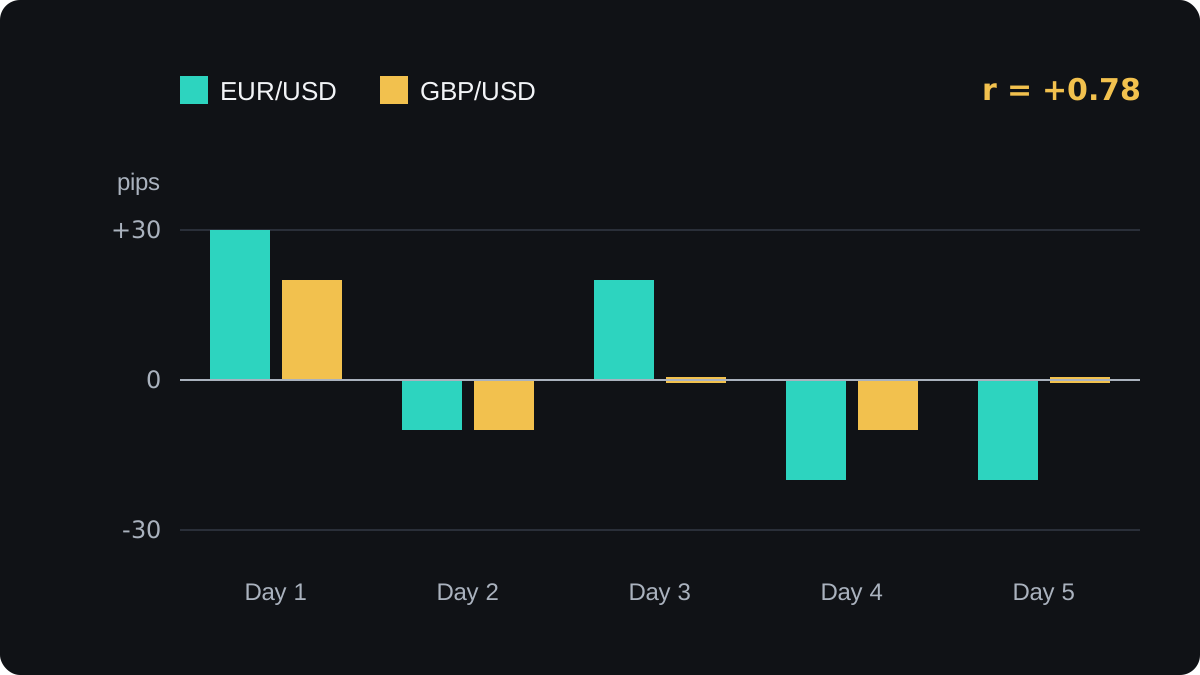
The result, r = +0.78, is a strong positive correlation, yet the pairs did not agree every day. On days 3 and 5, EUR/USD moved while GBP/USD stayed flat.
Now flip the sign of every GBP/USD change. Each product changes sign, so the sum becomes -900. The squares stay the same, and r becomes -0.78.
The units do not matter. Count the same moves in pipettes, ten to a pip, and r stays 0.78.
Many correlation tools work on daily changes in closing prices, often as percentages, while some use the price levels themselves. The two methods can give different readings for the same pairs, so check which one a tool uses.
Why do some pairs move together and others apart?
The main reason is a shared currency. EUR/USD and GBP/USD both have the US dollar as the quote currency, so a broad move in the dollar pushes both pairs the same way.
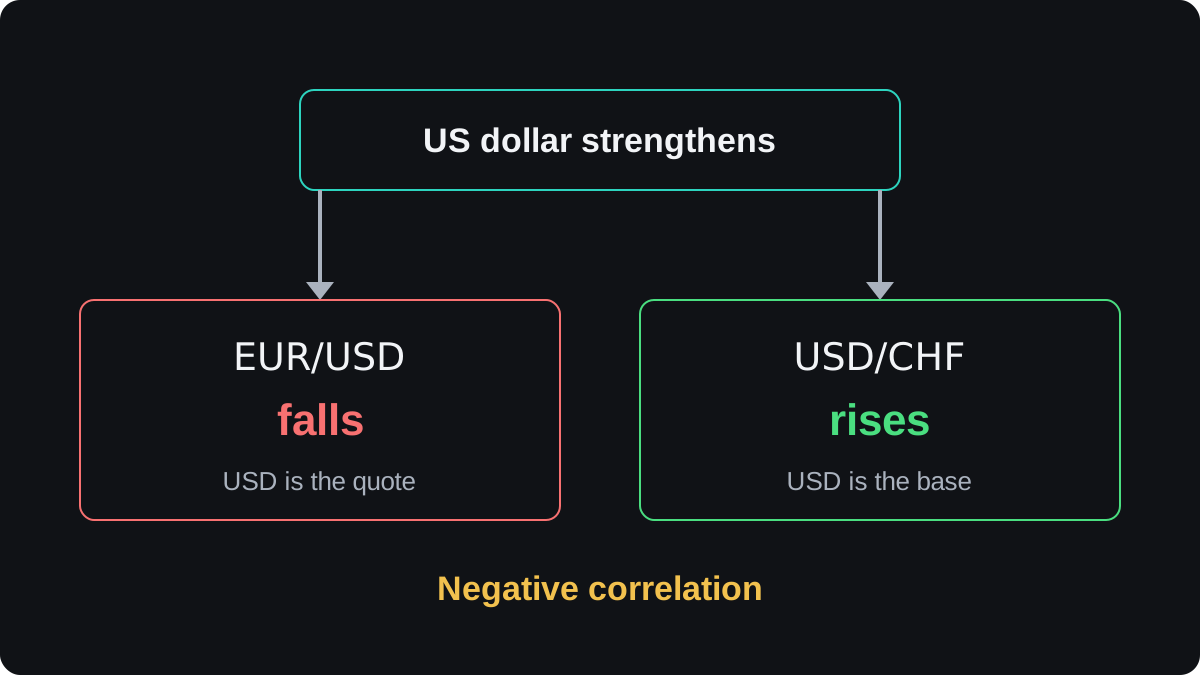
EUR/USD and USD/CHF also share the dollar, but it sits on opposite sides. In USD/CHF the dollar is the base currency, the first name in the pair.
When the dollar strengthens against most currencies, EUR/USD falls because each euro buys fewer dollars. USD/CHF rises because each dollar buys more francs.
Economic ties add to this. The Australian and New Zealand economies are closely linked and both rely on exports of raw materials and food, so AUD/USD and NZD/USD have often moved in the same direction.
A shared currency does not guarantee a strong link. Each pair also has a second currency with its own news, and that news can pull the pairs apart.
Where does correlation fail?
Correlation is a description of the past. It tells you how two pairs behaved over the period you measured, and it carries no promise about tomorrow.
It also changes. Two pairs can show a strong correlation for months and then drift apart when the policy or economic news in one country changes.
The answer depends on the window you choose. Twenty days of data and a full year can give very different readings for the same two pairs, and hourly data can differ from daily data.
A few large days can dominate the result. One big shared move, such as a surprise announcement that hits the dollar, can lift r even if the pairs were unrelated on most other days.
Correlation says nothing about cause either. Two pairs that move together are usually both reacting to something else, such as a move in the currency they share.
How can you check correlation yourself?
The correlation matrix shows coefficients for many pairs at once, so you can see which ones have been moving together. Note the period it uses before you read anything into a number.
A spreadsheet works too. Download daily closing prices for two pairs, work out each day's percentage change, and apply the CORREL function in Excel or Google Sheets to the two columns of changes.
Recheck the reading from time to time, and compare a short window with a long one. When they disagree, the relationship may be shifting.
Two strongly correlated trades can behave much like one larger trade, which the lesson on correlation and portfolio risk works through.
Pertanyaan
What is a good correlation coefficient?
No value is good or bad on its own. A strong positive reading warns that two trades in the same direction add up to a larger bet on one move, and a reading near 0 suggests the pairs have been moving independently.
Which currency pairs are usually positively correlated?
Pairs that share a currency on the same side, such as EUR/USD and GBP/USD, have often shown a positive correlation. Check a current reading, because the strength changes over time.
Can a negative correlation be used as a hedge?
A negatively correlated pair can offset part of a loss, rarely all of it, because the link is never perfect.
You also pay the spread on both positions and carry the swap on both, and the lesson on using correlations in your trading covers the trade-offs.
Does a correlation of +1 mean two pairs move the same number of pips?
No. It means they move in the same direction in a fixed proportion, so one pair could move 40 pips every time the other moves 20.
Lanjut belajar
 Bab 6Correlation and portfolio risk.When two currency pairs tend to move together, trades on both add up to one larger bet. Buying EUR/USD and GBP/USD with 1% risk each puts up to 2% at risk on one view of the US dollar. Direction matters too: buying one pair and selling a pair that moves opposite doubles the bet as well.
 Bab 6Using correlations in your trading.Correlation helps in three ways. A hedge offsets one position with a correlated pair, such as long EUR/USD and short GBP/USD. Comparing related pairs shows whether a move is about one currency or the dollar. Checking correlation before adding trades stops you stacking the same risk. Each use can fail when the relationship shifts.

