What is technical analysis?
Technical analysis is the study of past price movements, usually on a chart, to judge which way price may move next and to plan entries and exits. Traders look for trends, support and resistance levels, patterns and indicators. It helps with timing and risk planning, but it cannot predict price reliably.
Konten ini baru tersedia dalam bahasa Inggris.
Open a chart of EUR/USD and you see price drawn as a line or a row of candles, moving up and down over hours or days. Technical analysis is the practice of reading that history to plan a trade.
The previous lesson set it beside fundamental and sentiment analysis. Of the three, it is the only one that works from the chart alone.
What does a technical analyst look at?
A technical analyst looks mainly at price. A candlestick chart shows, for each period, where price opened, the highest and lowest points it reached, and where it closed.
A daily chart gives one candle per day, and an hourly chart gives one per hour. The reading rules are the same on both, so a trader who holds for minutes and one who holds for weeks can use the same tools.
Some traders add volume. Spot forex has no single exchange, so the volume on a retail platform is usually tick volume: a count of price changes in the period, with no record of how much money changed hands.
Technical analysis is the study of past price, usually on a chart, to judge which way price is more likely to move and to plan where to enter and exit. It deliberately sets aside why price moved.
That question belongs to fundamental analysis, the next lesson in this module.
Which ideas is it built on?
Chart reading rests on a few assumptions. Each one is partly true, and each has a weak spot worth knowing before you trust a chart.
The first is that price already reflects what the market knows. If a rate cut is widely expected, the currency has mostly adjusted before the announcement. Genuine surprises still move price sharply, though, and no chart warned of them.
The second is that once a move starts, price tends to keep going in that direction for a while. Trends do appear on charts, but a trend is only obvious after it has already run some distance.
The third is that people react to similar situations in similar ways, so some price shapes repeat. Part of this is self-fulfilling: if enough traders watch the same level, their orders cluster there and can make it matter.
How do you tell which way price is trending?
Look at the swings, the peaks and dips price makes along the way. In the illustrative EUR/USD chart below, price rises from 1.0770 to 1.0830, dips to 1.0800, climbs to 1.0860, dips to 1.0820 and then reaches 1.0880.
Each peak is higher than the last, and so is each dip. A run of higher highs and higher lows is the plain definition of an uptrend. A line drawn through the rising lows is called a trend line.
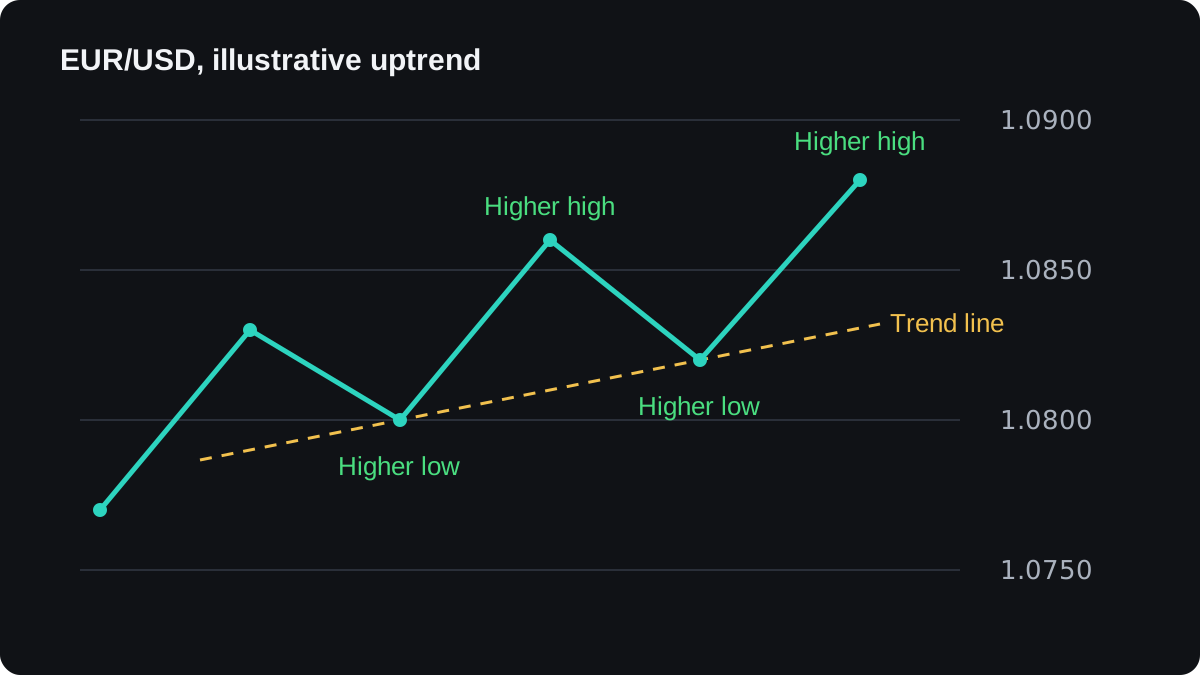
A downtrend is the mirror image, with lower highs and lower lows. When price swings between roughly the same high and low for a while, the market is ranging, and trend tools tend to give poor signals there.
The trend changes the question a chart reader asks. In an uptrend, the usual idea is to look for a dip to buy into. Selling against the trend means betting that it is about to end, which is harder to time.
Where does price tend to turn?
In the same chart, price fell to 1.0800 and bounced. A price where falls have stopped before is called support. A price where rises have stalled before is called resistance.
Traders watch these areas because orders can gather there: buyers waiting near support, sellers near resistance, and stop losses just beyond both. Round numbers such as 1.0800 often draw extra attention.
A level is better treated as a zone a few pips wide than as one exact price, because price rarely turns at the same decimal twice. The support and resistance lesson shows how to find and draw them.
When price breaks clearly through a level, the level can swap roles, so old resistance becomes support on the next dip. This does not always happen, and breaks that quickly reverse are part of normal price action.
What are chart patterns and indicators?
Patterns are shapes in price that chart readers name and look for. Some cover one to three candles, such as a hammer or an engulfing candle. Others take dozens of candles to form, such as a double top.
Indicators are formulas applied to price. The simplest is a moving average, the average closing price over a set number of periods, recalculated as each new period closes.
Take five illustrative daily closes on EUR/USD: 1.0800, 1.0820, 1.0810, 1.0840 and 1.0830. Their sum is 5.4100, and 5.4100 ÷ 5 = 1.0820. That is the 5-period simple moving average on day 5.
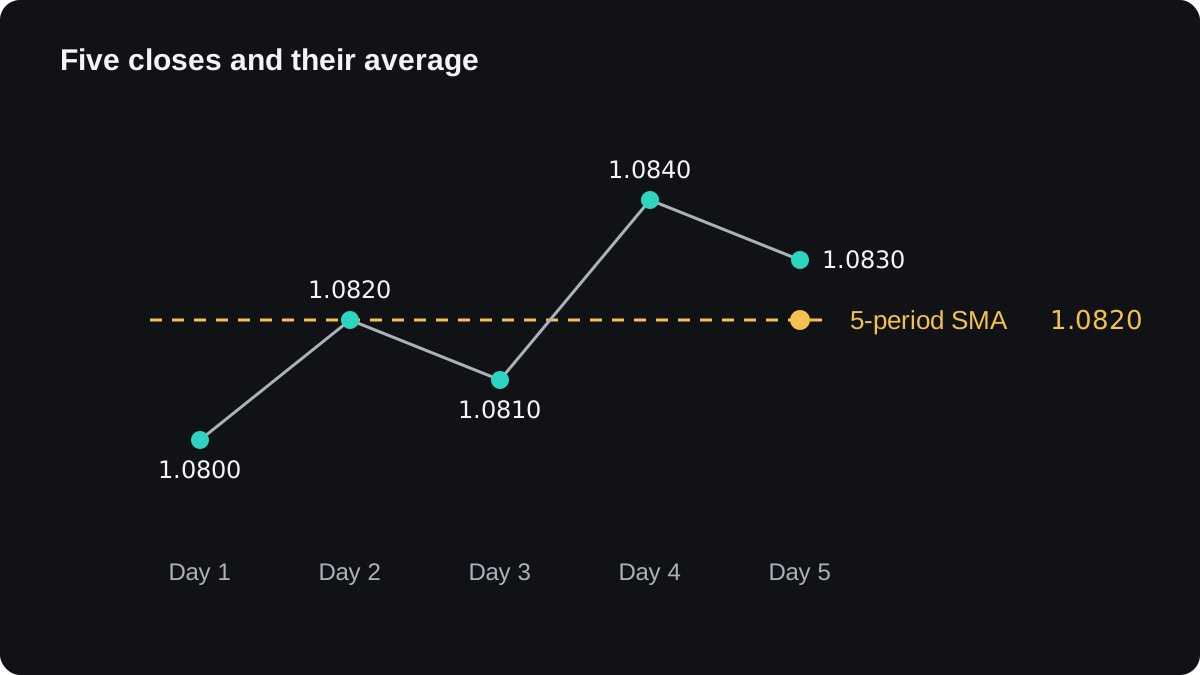
Because it uses only past closes, the average always trails price. The smoothing makes direction easier to see, and it also means the average turns after price has already turned. Every indicator built from past prices has some lag.
An indicator adds no new information. It reshapes prices you can already see, so two indicators built from the same closes often agree for that reason alone, which is weaker evidence than it looks.
How does a chart become a trade plan?
The most practical use of a chart is deciding where to enter, where the idea is proven wrong and where to take profit. Here is an illustrative example using the uptrend above. It is an example, not a recommendation.
- EUR/USD is in an uptrend and dips toward support near 1.0800. You plan to buy at 1.0810.
- If price falls back through support, the idea is wrong. You put the stop loss at 1.0780, so 1.0810 minus 1.0780 = 0.0030, a distance of 30 pips.
- You set the target just below the last high of 1.0880, at 1.0870. That gives 1.0870 minus 1.0810 = 0.0060, or 60 pips.
- On 0.10 lot, which is 10,000 euros, one pip is worth 10,000 × 0.0001 = $1. The risk is 30 × $1 = $30, and the possible reward is 60 × $1 = $60.
- On a $3,000 account, $30 ÷ $3,000 = 1% of the balance. The reward is twice the risk, a risk-reward ratio of 1:2.
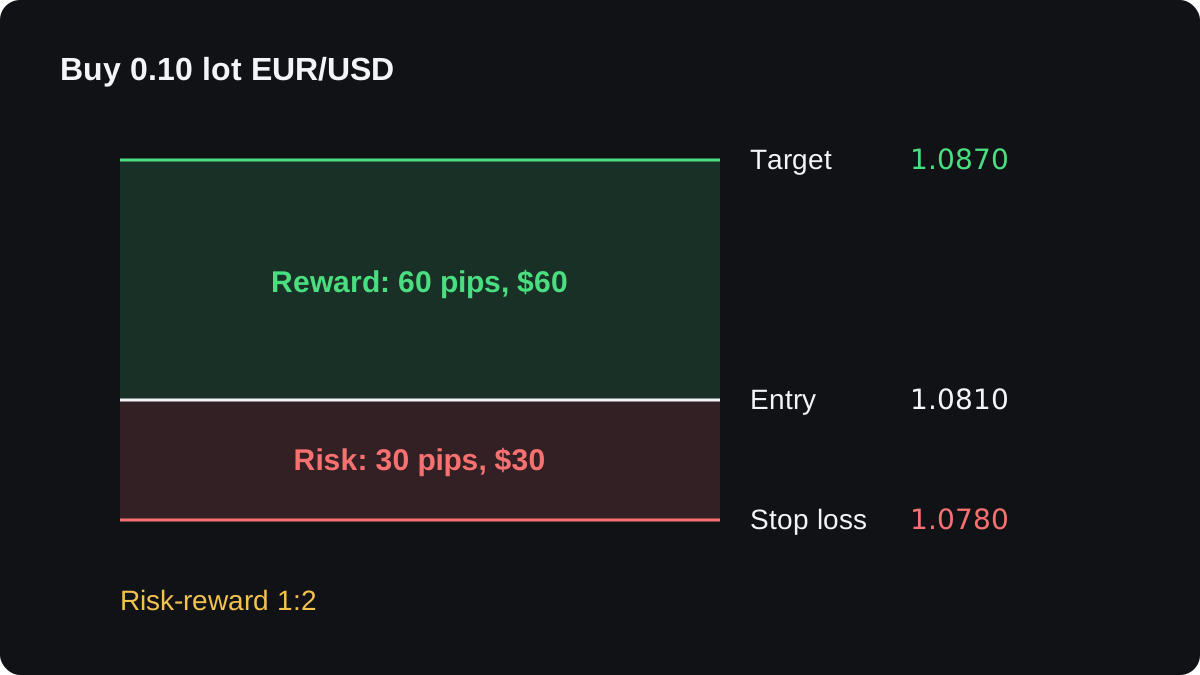
These sums ignore the spread, which would add a small cost on entry. They also say nothing about the odds of reaching the target first.
A 1:2 plan breaks even, before costs, if it wins one trade in three. If the stop is hit more often than two times in three, the plan loses money over many trades.
Where does technical analysis fall short?
Two people can read the same chart differently. Where you start a trend line, which swing counts as a high and which timeframe you choose all change the answer.
Charts also look clearer in hindsight. A pattern that seems obvious on yesterday's chart was one of several possible shapes while it was still forming.
News can override any level. A surprise data release or central bank decision can push price through support in seconds, and a stop may then fill at a worse price than the one you set.
The evidence is mixed. Academic studies of simple trading rules in currency markets have found profits in some periods and pairs, and weaker results in others, especially once trading costs are counted.
Treat any claim that a pattern reliably works with caution. A fairer way to judge a method is to test it on past data and then on a demo account, with costs included. The backtesting lesson walks through the process.
Pertanyaan
Does technical analysis work in forex?
It can help you plan entries, stops and targets, but it cannot predict price reliably. Research results are mixed, so test any method with realistic costs before you trust it.
Is technical or fundamental analysis better?
Neither is better in every case. Fundamental analysis tries to explain why a currency should move, and charts help with timing, so the two can be combined.
What timeframe is best for technical analysis?
There is no single best one. Shorter charts give more signals and more noise, while longer charts give fewer signals and usually need wider stops, so the choice depends on how long you plan to hold a trade.
Do you need indicators for technical analysis?
No. Price alone shows trends and levels, and indicators are formulas built from those same prices. Some traders use none, and others add one or two to help read the trend.
Can technical analysis predict the future?
No. At best it suggests which outcome looks more likely given past behaviour, and every chart setup fails some of the time, which is why a stop loss belongs in the plan.
Lanjut belajar
 Bab 2The three ways to analyse the forex market.Forex traders analyse the market in three ways. Technical analysis reads price charts to ask what price has done. Fundamental analysis reads economic data and interest rates to ask why a currency might move. Sentiment analysis reads trader positioning to ask how the crowd is leaning. Each answers a different question and fails in its own way.
 Bab 2What is fundamental analysis?Fundamental analysis judges a currency by the economy behind it: interest rates, inflation, growth, jobs and government policy. In forex it always compares two economies, because a pair prices one currency in another. Prices react most to surprises against forecasts, and the method is better at explaining direction over months than at timing trades.
 Bab 2What is sentiment analysis in forex?Sentiment analysis measures how other traders are positioned, such as the share of a broker's clients who are long or short a pair, or speculators' net futures positions in the weekly COT report. It is often read as a contrarian signal, because a crowded trade can unwind, but positioning says little about timing.
 Bab 2Technical, fundamental or sentiment: which should you use?No single approach is best. Fundamental analysis suggests which way a currency should drift, sentiment shows whether that view is already crowded, and technical analysis sets the entry, stop and target. You can use all three in that order, from the slow view to the fast one, and keep each chart to one tool per question.

