The three ways to analyse the forex market.
Forex traders analyse the market in three ways. Technical analysis reads price charts to ask what price has done. Fundamental analysis reads economic data and interest rates to ask why a currency might move. Sentiment analysis reads trader positioning to ask how the crowd is leaning. Each answers a different question and fails in its own way.

Two traders can look at EUR/USD at the same moment and reach opposite views, and both can have done their homework. One has been reading a chart. The other has been reading a central bank statement.
Forex analysis falls into three broad types. Each one asks its own question about the same price, and each has its own way of being wrong.
What question does each type of analysis ask?
Technical analysis studies past price movement on a chart. It asks what price has done, and what that might suggest about the next move.
Fundamental analysis studies the economy behind a currency, such as interest rates, inflation, growth and central bank policy. It asks why a currency might rise or fall over weeks or months.
Sentiment analysis studies how other traders are positioned and how they feel about risk. It asks whether the crowd is already leaning heavily one way.
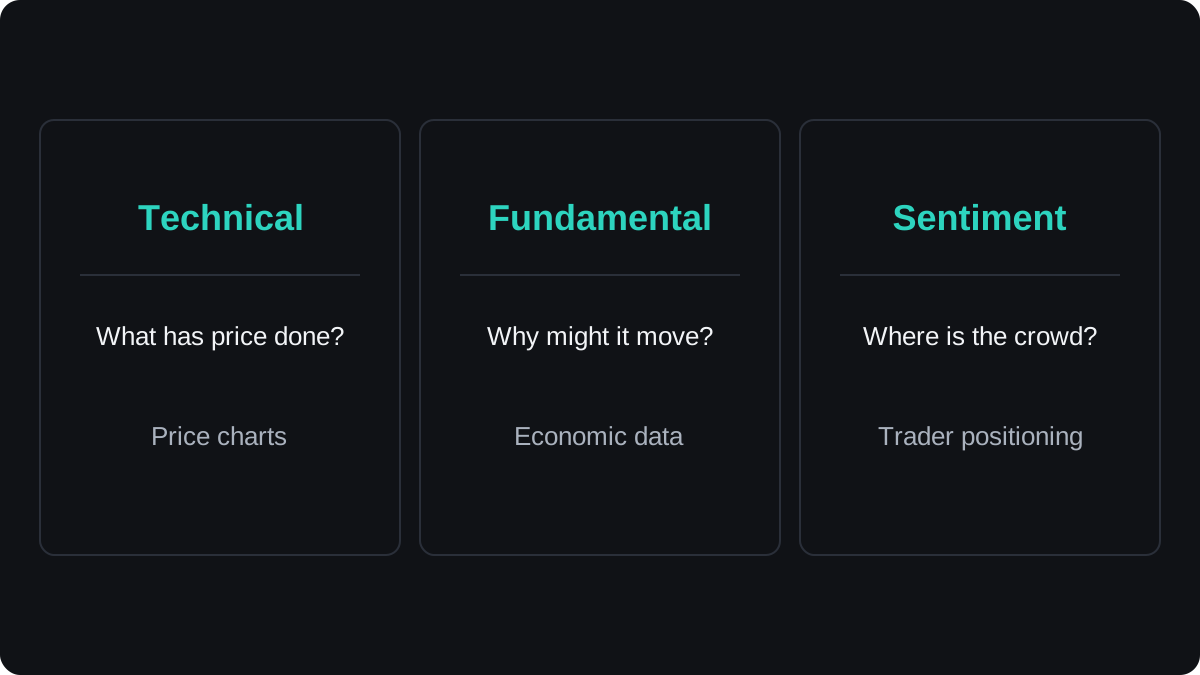
All three study the same exchange rate. They differ in which evidence they trust and how far ahead they look, from minutes on a chart to months in an economic cycle.
How technical analysis reads the chart
Picture a chart of EUR/USD that has turned lower near 1.10500 several times. A technical trader marks that price as resistance and watches what happens on the next visit.
The idea behind the method is that price already reflects much of what is known. Traders also tend to react to similar situations in similar ways, which leaves repeated shapes on the chart.
The tools include support and resistance, trend lines, candlestick patterns, moving averages and indicators such as RSI.
Its practical strength is precision. A chart gives exact prices for an entry, a stop loss and a target, which a phrase like slowing growth never can.
Its weak spot is the evidence. Rules that look profitable on past data often fade once trading costs are included or conditions change, so treat any pattern as a probability with exceptions.
The technical analysis lesson covers the method in more detail.
What fundamental analysis looks for
Suppose the US central bank hints at higher rates while the European Central Bank hints at cuts. A fundamental trader expects money to drift toward the dollar, which would push EUR/USD down.
Interest rates are usually the biggest single input. Other things being equal, a currency that pays a higher rate tends to attract money from abroad.
Prices react mostly to changes in expectations, because the current rate is already in the price. The interest rates lesson explains why.
Inflation, employment, growth and retail sales figures matter because they shift what traders expect central banks to do next. The economic calendar shows when each release is due.
Fundamental analysis is good at explaining large moves that build over months. Its weak spot is timing: a currency can stay far from where the economic story says it belongs for a long time.
Short-run currency moves have also proved hard to forecast from economic data alone. More on the method is in what fundamental analysis is.
What sentiment analysis measures
Imagine EUR/USD falling for weeks while nearly every trader you follow is short. Nothing in the economic data has changed, yet the trade has become crowded.
Traders read sentiment from positioning pages that some brokers publish about their own clients, the weekly Commitments of Traders report on futures markets, and the general appetite for risk seen in stock markets.
A common use is contrarian. If a large share of retail traders hold one side, some traders lean the other way, reasoning that a crowded position can unwind quickly once it starts to lose.
The weak spot is that crowds can stay crowded while a trend keeps running. Each data source also sees only part of a market that has no central exchange.
The sentiment analysis lesson looks at these sources one by one.
One pair through all three lenses
Take one illustrative setup, with round numbers chosen so the arithmetic is easy to follow. EUR/USD trades at 1.10000, and for several weeks it has moved between 1.09500 and 1.10500.
The technical reading
- The range is 1.10500 minus 1.09500 = 0.01000, which is 100 pips.
- Price sits at 1.10000, 50 pips below resistance and 50 pips above support.
- On 0.10 lot of EUR/USD in a US dollar account, one pip is worth $1, so a move across the full range is worth $100 at that size.

In the middle of a range the chart offers no clear lean. A range trader might wait for price to reach a boundary.
Say the plan is a buy at 1.09600, with a stop loss at 1.09400 and a target at 1.10400. The risk is 1.09600 minus 1.09400 = 0.00200, or 20 pips, so 20 × $1 = $20.
The target is 1.10400 minus 1.09600 = 0.00800, or 80 pips, so 80 × $1 = $80. The chart supplied those exact prices, but it cannot say whether support will hold this time.
The fundamental reading
Suppose, purely as an illustration, that the US policy rate is 4.00% and the euro area rate is 2.00%. The gap is 4.00 minus 2.00 = 2.00 percentage points in favour of the dollar.
That gap is already in the price, so the fundamental trader asks where it is heading.
If markets expect the US rate to stay at 4.00% and the euro area rate to fall to 1.75%, the expected gap widens to 4.00 minus 1.75 = 2.25 points.
A widening gap in the dollar's favour points to EUR/USD lower. If new data instead made a euro area rate rise more likely, the expected gap would narrow and the lean could flip.
The sentiment reading
Suppose a broker's positioning page shows 7,000 of 10,000 open retail EUR/USD positions are short. That is 7,000 ÷ 10,000 = 70% short, and a contrarian reads it as a lean toward EUR/USD higher.

The three readings disagree, and that is normal. Each one weighs different evidence over a different time span, so a trader has to decide in advance which one has the final say.
How do the three methods compare?
The table puts the question, the inputs and the typical failure of each method side by side.
| Method | Question it asks | Main inputs | Typical failure |
|---|---|---|---|
| Technical | What has price done? | Price, patterns, indicators | Patterns fail, past rules fade |
| Fundamental | Why might it move? | Rates, inflation, growth data | Right story, wrong timing |
| Sentiment | Where is the crowd? | Positioning, COT report, risk | Crowded trades keep running |
One common way to combine them uses fundamentals for direction, charts for timing and sentiment as a warning when a trade looks crowded.
Agreement between methods is still no guarantee. A surprise data release can move price through every level at once, whatever the three readings said beforehand.
The comparison lesson at the end of this module helps you choose a mix that fits your timeframe.
Questions
Which type of forex analysis is best?
No single type is best for everyone. Short-term traders often lean more on charts and longer-term traders more on economics, so the right mix depends on your timeframe.
Can you trade forex with technical analysis only?
Some traders use charts alone. Even then, it helps to know when major data releases are scheduled, because they can move price straight through chart levels.
What is the difference between fundamental and sentiment analysis?
Fundamental analysis asks what the economy suggests a currency should do. Sentiment analysis asks how traders are already positioned and how they feel about risk, whatever the data says.
Is sentiment analysis reliable?
Its record is mixed. Positioning data covers only part of the market, and a crowded trade can keep moving in the crowd's favour for a long time.
Keep learning
 Chapter 2What is technical analysis?Technical analysis is the study of past price movements, usually on a chart, to judge which way price may move next and to plan entries and exits. Traders look for trends, support and resistance levels, patterns and indicators. It helps with timing and risk planning, but it cannot predict price reliably.
 Chapter 2What is fundamental analysis?Fundamental analysis judges a currency by the economy behind it: interest rates, inflation, growth, jobs and government policy. In forex it always compares two economies, because a pair prices one currency in another. Prices react most to surprises against forecasts, and the method is better at explaining direction over months than at timing trades.
 Chapter 2What is sentiment analysis in forex?Sentiment analysis measures how other traders are positioned, such as the share of a broker's clients who are long or short a pair, or speculators' net futures positions in the weekly COT report. It is often read as a contrarian signal, because a crowded trade can unwind, but positioning says little about timing.
 Chapter 2Technical, fundamental or sentiment: which should you use?No single approach is best. Fundamental analysis suggests which way a currency should drift, sentiment shows whether that view is already crowded, and technical analysis sets the entry, stop and target. You can use all three in that order, from the slow view to the fast one, and keep each chart to one tool per question.

