Ichimoku Kinko Hyo.
Ichimoku Kinko Hyo is a Japanese trend indicator with five lines: a 9-period conversion line, a 26-period base line, two leading spans that form a cloud 26 periods ahead, and the close plotted 26 periods back. Price above the cloud is read as an uptrend bias, below it as a downtrend bias.
ខ្លឹមសារនេះមានតែជាភាសាអង់គ្លេសសិន។

Many indicators add one line to a chart. Ichimoku Kinko Hyo adds five, plus a shaded band called the cloud, and you read them together. The name is Japanese and roughly means a one-glance equilibrium chart.
It was developed by a Japanese newspaper writer, Goichi Hosoda, who published under the pen name Ichimoku Sanjin. Today it is a standard indicator on most charting platforms, including MetaTrader 4 and 5.
Like the ADX in the previous lesson, Ichimoku is mainly a trend tool. It also draws price levels on the chart, so you can see where past ranges sat.
What are the five lines of Ichimoku?
Four of the five lines start from a midpoint: the highest high plus the lowest low over a set number of candles, divided by two. The fifth is simply the closing price.
A moving average changes with every close. A midpoint changes only when a new high or low enters its window, or an old one drops out.
The default periods are 9, 26 and 52 candles. On a daily chart a candle is one session, and on an hourly chart it is one hour.
| Line | Japanese name | How it is built | Where it is drawn |
|---|---|---|---|
| Conversion line | Tenkan-sen | Midpoint of the last 9 candles | On the current candle |
| Base line | Kijun-sen | Midpoint of the last 26 candles | On the current candle |
| Leading span A | Senkou span A | Average of the conversion and base lines | 26 candles ahead |
| Leading span B | Senkou span B | Midpoint of the last 52 candles | 26 candles ahead |
| Lagging span | Chikou span | The current close | 26 candles back |
The cloud, also called the kumo, is the space between the two leading spans. Many platforms shade it one colour when span A is above span B, and another colour when span B is on top.
A common explanation for 9, 26 and 52 is the six-day trading week Japan used when the system was built, which made 26 sessions about a month.
You can change the periods, though every reading in this lesson assumes the defaults.
How do you calculate the Ichimoku lines?
Take a daily EUR/USD chart with round illustrative prices. For each line you need only the highest high and the lowest low inside its window.
- Conversion line: in the last 9 sessions the high was 1.10600 and the low 1.09800. (1.10600 + 1.09800) ÷ 2 = 1.10200.
- Base line: in the last 26 sessions the high was 1.11000 and the low 1.09000. (1.11000 + 1.09000) ÷ 2 = 1.10000.
- Leading span A: (1.10200 + 1.10000) ÷ 2 = 1.10100.
- Leading span B: in the last 52 sessions the high was 1.11500 and the low 1.08100. (1.11500 + 1.08100) ÷ 2 = 1.09800.
- Cloud thickness: 1.10100 minus 1.09800 = 0.00300, which is 30 pips.
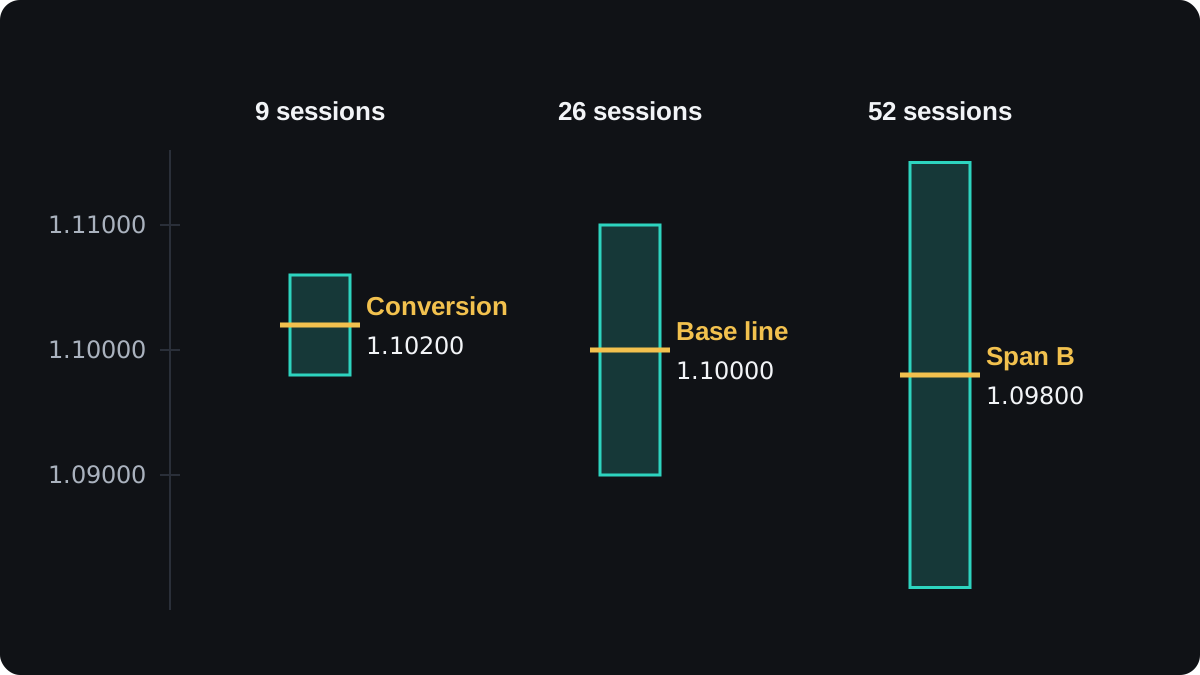
The two spans you just worked out belong to the cloud 26 sessions from now. The cloud sitting under today's candle was calculated 26 sessions ago.
A yen pair works the same way with a different pip. A USD/JPY cloud from 150.20 to 150.80 is 0.60 thick, which is 60 pips, because a JPY pair's pip is 0.01.
Why are some lines shifted forward or back?
The shifts are what make an Ichimoku chart look crowded. The cloud is pushed 26 candles to the right of price, and the lagging span is pulled 26 candles to the left.
In the example, the cloud for 26 sessions ahead runs from 1.09800 to 1.10100. It is made entirely of past highs and lows, so treat it as a reference zone. It does not forecast where price will be.
The lagging span is today's close drawn 26 candles back. If today's close is 1.10450, the line is plotted at 1.10450 in the position of the candle from 26 sessions ago.
You then compare it with price at that point. The close back then was 1.09600, so today's close is 1.10450 minus 1.09600 = 0.00850 higher, or 85 pips.
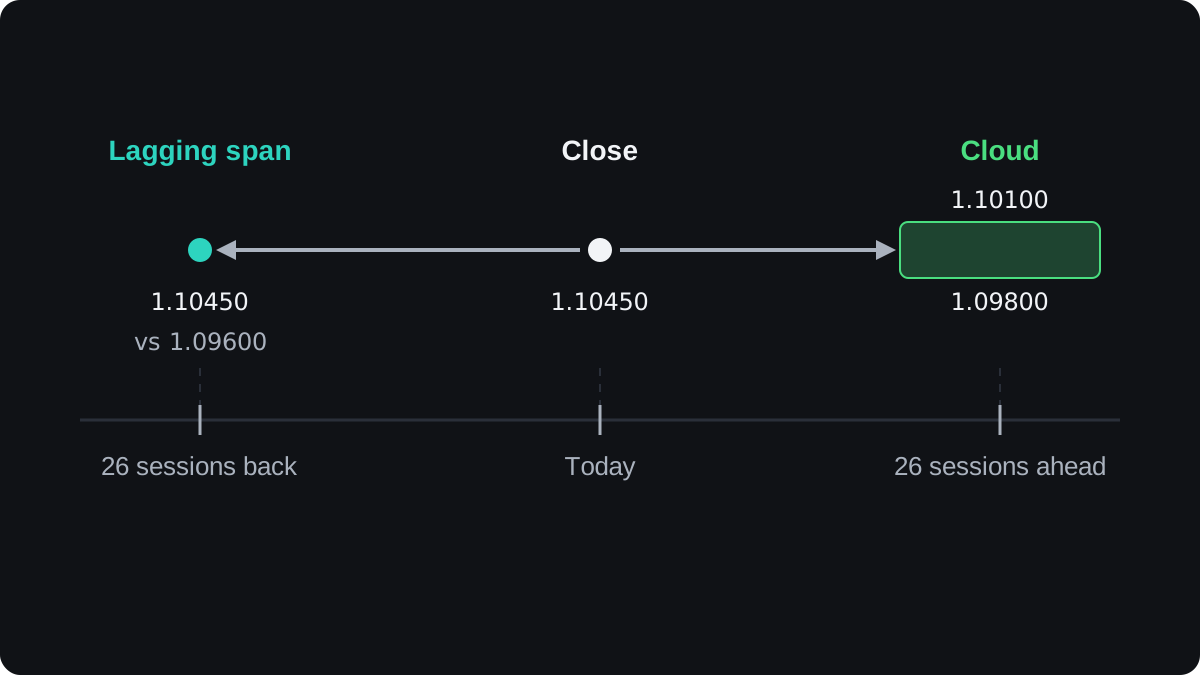
On any live chart, the lagging span therefore stops 26 candles before the last candle, and the cloud runs 26 candles past it.
How do you read an Ichimoku chart?
Begin with price against the cloud under the current candle. Price above the cloud is read as an uptrend bias, below it as a downtrend bias, and inside it as no clear trend.
In the example, today's cloud runs from 1.09500 to 1.09900 and the close is 1.10450. That puts price 1.10450 minus 1.09900 = 0.00550, or 55 pips, above the cloud top.
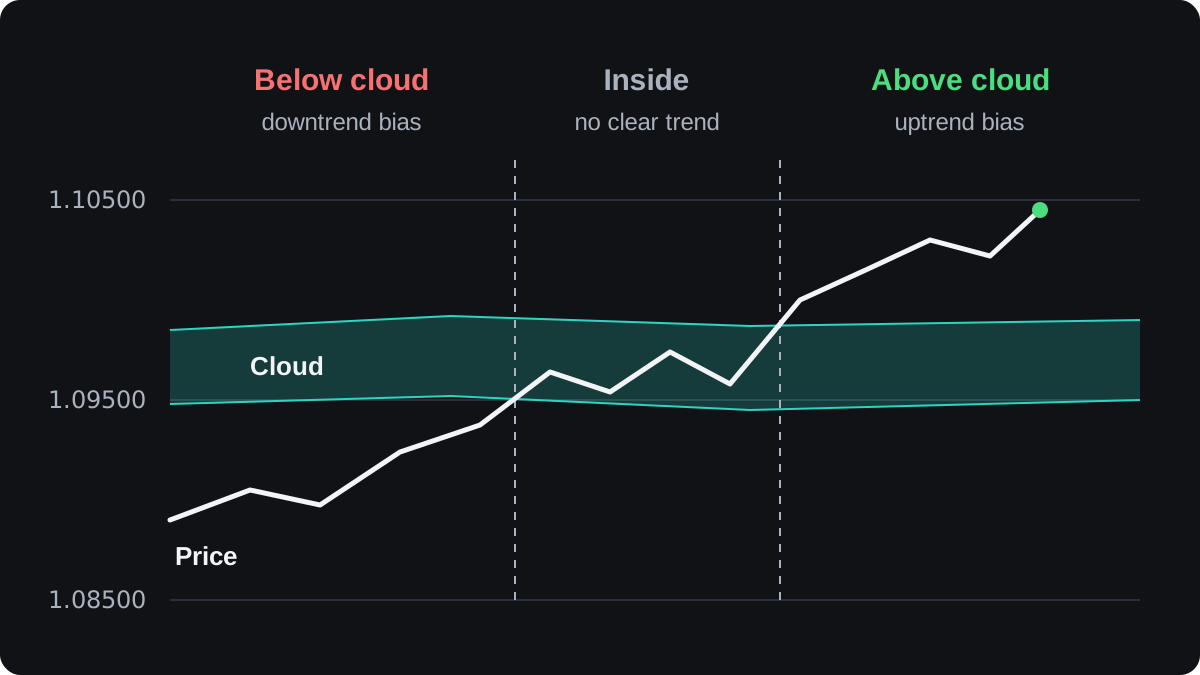
The other lines then either agree with that reading or argue with it. In this example they all agree:
- The conversion line at 1.10200 is above the base line at 1.10000, so the 9-session midpoint is higher than the 26-session one.
- The lagging span at 1.10450 is above the 1.09600 close it is compared with.
- In the future cloud, span A at 1.10100 is above span B at 1.09800, which many platforms shade as a bullish cloud.
When the lines disagree, for example price above the cloud while the conversion line falls through the base line, the plain reading is that the trend is in doubt.
Crosses, cloud edges and the base line
A TK cross is the conversion line (tenkan) crossing the base line (kijun). Crossing upward is read as bullish, and crossing downward as bearish.
Classic readings rate a bullish cross above the cloud as strong, one inside the cloud as neutral and one below it as weak. Bearish crosses are rated the same way in reverse.
The cloud edges are often treated as a support and resistance zone. A thick cloud marks a wide spread of past prices and is read as a firmer barrier than a thin one.
The base line stays flat until a new 26-candle high or low arrives, so it often looks like a staircase. You may see stops placed just beyond it, which is a rule to test like any other.
Where does Ichimoku fail?
Every line is built from past prices, so Ichimoku lags. After a sharp reversal, price may travel a long way before it crosses the cloud, and much of the move can be over by then.
Sideways markets are the hardest case. Price drifts through a thin cloud, the conversion and base lines cross back and forth, and many of those crosses reverse soon after.
The lesson on trending and ranging markets covers ways to tell the two apart before you trust a trend signal.
The defaults were set with daily charts in mind. On a five-minute chart, 26 candles is 130 minutes, so the base line there describes about two hours of trading instead of about a month.
Public evidence that Ichimoku signals beat simpler methods after trading costs is thin and mixed. Treat any Ichimoku rule as an idea to backtest on your own pairs and timeframe before you risk money on it.
Five lines also repeat some of what other indicators show. Stacking RSI or MACD on top can count the same information twice, which is the subject of combining indicators.
សំណួរ
What are the best Ichimoku settings?
No setting has been shown to be best. The defaults of 9, 26 and 52 are what most charts use, so changing them makes your readings harder to compare, and any change needs testing on past data first.
What does it mean when price is inside the cloud?
It is read as no clear trend. Signals from the other lines are usually treated as weaker until price closes outside the cloud.
Does the Ichimoku cloud predict the future?
No. The cloud is drawn 26 candles ahead, but it is calculated from past highs and lows, and price can move straight through it.
Is Ichimoku good for beginners?
It is harder to read than a single line, because five lines can disagree. Learning what each line measures and practising on a demo account makes it much easier to follow.
បន្តរៀន
 ជំពូក 5Bollinger Bands.Bollinger Bands are three lines on a price chart: usually a 20-period simple moving average in the middle, with bands two standard deviations above and below it. The bands widen when price moves a lot and narrow when it is quiet. A narrow stretch, called a squeeze, often comes before a larger move in either direction.
 ជំពូក 5MACD indicator.MACD, short for moving average convergence divergence, measures the gap between a 12-period and a 26-period exponential moving average of price. A 9-period EMA of that gap forms the signal line, and the histogram shows the difference between the two. It is read as momentum, but it lags price and gives many false signals in ranges.
 ជំពូក 5Parabolic SAR.Parabolic SAR is a trend indicator that draws a dot for each bar, below price in an uptrend and above it in a downtrend. The dots move closer to price as the trend extends, and when price crosses them they flip sides. It is often used as a trailing stop, and it gives many false flips in sideways markets.
 ជំពូក 5Stochastic oscillator.The stochastic oscillator shows where the latest close sits within the high to low range of a set number of candles, on a scale of 0 to 100. Readings above 80 are called overbought and below 20 oversold. They describe recent closes near the top or bottom of the range and do not mean price must reverse.
 ជំពូក 5Relative Strength Index (RSI).The Relative Strength Index (RSI) is a momentum indicator that compares the size of recent gains with recent losses and plots the result from 0 to 100. The default uses 14 candles. Readings above 70 are called overbought and below 30 oversold, but in a strong trend RSI can stay beyond those lines for a long time.
 ជំពូក 5Average Directional Index (ADX).The Average Directional Index (ADX) measures how strong a trend is on a scale of 0 to 100, without saying which way it points. Readings above about 25 are commonly read as a trending market and below about 20 as a weak or ranging one. Two companion lines, +DI and −DI, show direction.
 ជំពូក 5How to combine indicators.Combine indicators by giving each one a different job. Use one tool to read the trend's direction or strength, and another to time entries, such as a moving average with RSI. Avoid stacking tools that measure the same thing, like RSI and Stochastic together, because they repeat one signal and only look like confirmation.
 ជំពូក 5Chart indicators cheat sheet.A chart indicator turns past prices into a number or line. Bollinger Bands measure volatility. MACD, Parabolic SAR and Ichimoku follow trend direction. RSI and the stochastic measure momentum, and ADX measures trend strength. Each has a common signal, and each fails in a predictable kind of market, usually trends for oscillators and ranges for trend tools.

