Top-down analysis step by step.
Top-down analysis means reading the same pair from the largest chart to the smallest before you trade. The weekly chart sets the direction, the daily chart finds the price zone, and the 4-hour chart times the entry, stop and size. If the charts disagree, you wait.
ខ្លឹមសារនេះមានតែជាភាសាអង់គ្លេសសិន។

The same pair can be rising on the weekly chart and falling on the 4-hour chart. Top-down analysis is a fixed order for handling that: you read the largest timeframe first and only move down when it gives you a reason to.
This lesson follows one EUR/USD setup through weekly, daily and 4-hour charts. The previous lesson covered how to pick a set like this. Every price here is a round illustrative number.
What does each chart decide?
Each timeframe answers one question, and that answer limits what the next chart is allowed to tell you. When two charts disagree, the larger one wins.
| Step | Chart | Question | Answer in this example |
|---|---|---|---|
| 1 | Weekly | Which way is the trend? | Up: higher highs and higher lows |
| 2 | Daily | Where would you act? | Support zone 1.0850 to 1.0900 |
| 3 | 4-hour | Has price turned? | Break above 1.0940 |
| 4 | 4-hour | Stop, target, size? | Stop 1.0870, target 1.1110, 0.06 lot |
Write down the answer to each question before you open the next chart. That stops one attractive 4-hour candle from rewriting your view of the weekly trend.
Step 1: read the trend on the weekly chart
On the weekly chart, EUR/USD climbed from a low of 1.0500. It stalled twice at 1.0900, broke through, and made a new high at 1.1200.
The lows along the way were 1.0500, 1.0700 and 1.0750. Rising highs with rising lows are the plain definition of an uptrend, covered in the swing highs and lows lesson.
Price has since pulled back to 1.0880, just under the old ceiling of 1.0900 that buyers broke on the way up. A broken ceiling can turn into a floor, though it often does not, as when support becomes resistance explains.
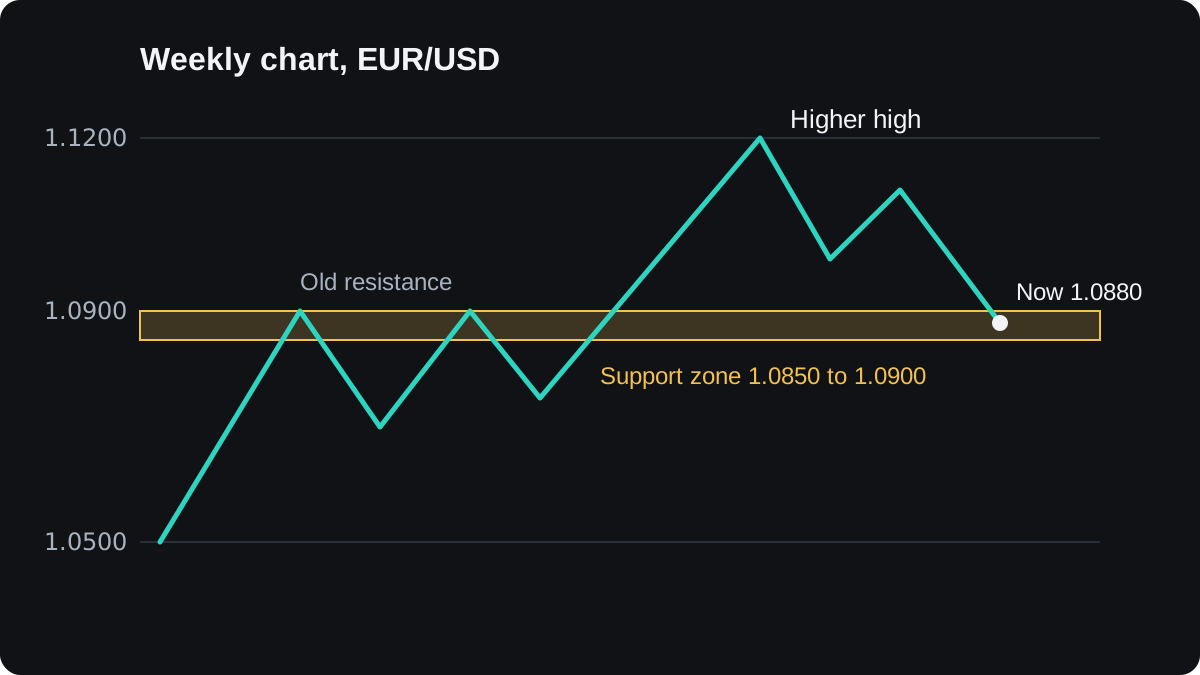
The weekly conclusion: the trend is up, and price sits at a level where buyers may return. The plan therefore allows long trades only and ignores short setups on the lower charts.
That view holds while price stays above the last weekly higher low at 1.0750. A pullback always contains its own small lower highs, so they do not cancel the weekly trend on their own.
Step 2: mark the zone on the daily chart
The daily chart shows the pullback in more detail. After the 1.1200 high, price fell to about 1.0990, bounced to a lower high at 1.1110, and then dropped into the area between 1.0850 and 1.0900.
Draw that area as a zone with a top and a bottom. Prices around an old level are messy, and a zone 50 pips deep (1.0900 minus 1.0850 = 0.0050) leaves room for that.
The daily chart also gives you a target. The 1.1110 lower high is the last place sellers pushed price down during the pullback, so it is the first obvious obstacle if the uptrend resumes.
At this point the written plan reads: buy only if the 4-hour chart shows price turning up in or near 1.0850 to 1.0900.
If a daily candle closes below 1.0850, the zone has failed and the plan is cancelled.
Step 3: wait for the turn on the 4-hour chart
The 4-hour chart is where you time the trade. On the way into the zone, price falls in steps, and its last bounce tops out at 1.0940.
Price then makes a low at 1.0880, inside the daily zone, and starts rising. The next dip stops at 1.0915, a higher low. A break above 1.0940 would end the small 4-hour downtrend.
That break is the trigger, the event that turns the plan into a trade. Here you place a buy stop order at 1.0950, 10 pips above the swing high, so the trade opens only if price moves through.
The order types lesson explains how buy stops work.
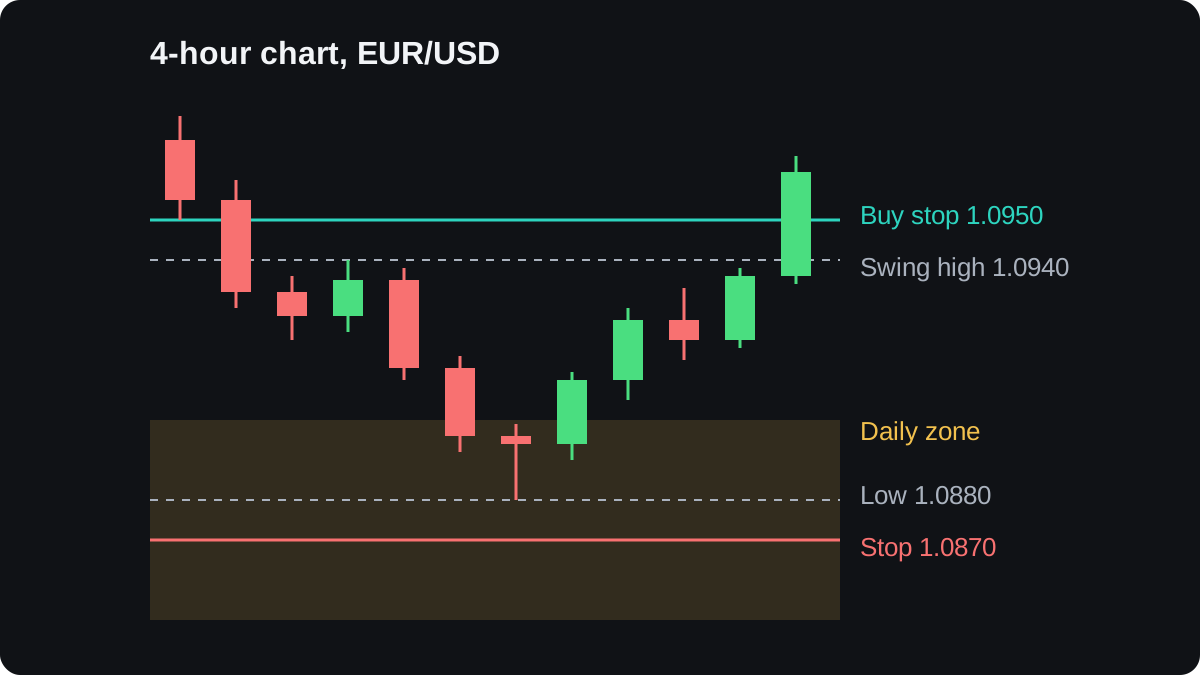
The stop loss goes 10 pips below the 4-hour low of 1.0880, at 1.0870. If price falls back there, the turn has failed and the reason for the trade is gone.
Step 4: set the stop, target and size
With entry, stop and target taken from the charts, the sums follow. Assume a $5,000 account in US dollars that risks 1% per trade. The spread and slippage are ignored to keep the arithmetic clear.
- Risk in money: $5,000 × 1% = $50.
- Stop distance: 1.0950 minus 1.0870 = 0.0080, which is 80 pips.
- Pip value needed: $50 ÷ 80 = $0.625 per pip.
- On EUR/USD one lot is worth $10 per pip, so $0.625 ÷ $10 = 0.0625 lot, rounded down to 0.06 lot.
- On 0.06 lot a pip is worth $0.60, so the actual risk is 80 × $0.60 = $48.
- Target distance: 1.1110 minus 1.0950 = 0.0160, which is 160 pips.
- Potential gain: 160 × $0.60 = $96, twice the risk.
Round the lot size down so the real risk stays at or under the amount you planned. The position size lesson and the lot size calculator repeat this sum for other pairs.
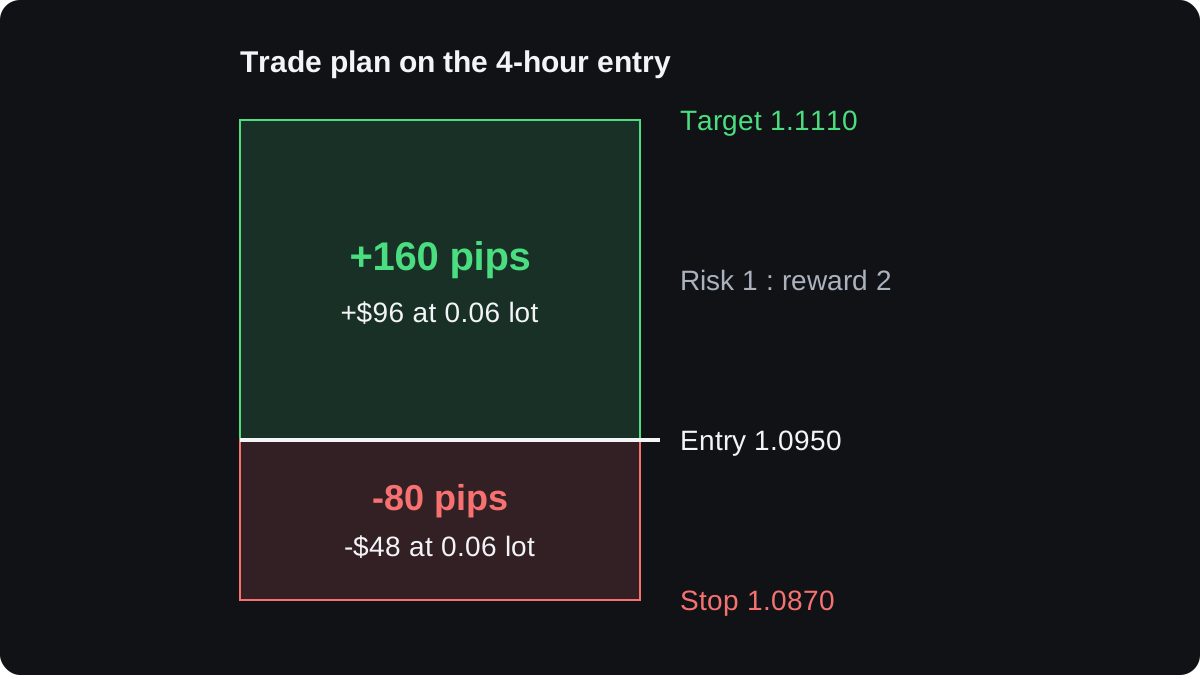
A 1 to 2 risk-reward ratio tells you what you gain at the target compared with what you lose at the stop. It says nothing about how likely either outcome is.
When the charts disagree, and where this fails
Often the charts do not line up. The weekly trend may be up while daily price floats far from any zone, or price may reach the zone while the 4-hour chart keeps falling.
In both cases the method says wait, so expect to spend more time waiting than trading.
The method has real limits:
- Trends end. This weekly uptrend could be turning, and a daily close below 1.0850 would be the first sign, after your stop at 1.0870 had already been hit.
- Triggers fail. A break above a 4-hour swing high can reverse within a few candles, which is a false breakout.
- You choose the levels. Two traders can draw the daily zone 20 pips apart and end up with different trades.
- Hindsight flatters. Lesson charts, this one included, are drawn so the steps are easy to see.
There is little published, independent evidence that lining up timeframes improves results by itself. Treat top-down analysis as a way to order your decisions.
Test your own version with a backtest and a demo account before relying on it.
សំណួរ
What timeframes should I use for top-down analysis?
Any set where each chart covers several times more time than the next one follows the same steps. Weekly, daily and 4-hour suit swing trades, and a day trader might use daily, 1-hour and 15-minute charts.
Do all the timeframes have to agree?
In this method, yes. The trade is taken only when the higher charts allow the direction and the entry chart shows a trigger; otherwise you wait.
Can I trade against the weekly trend?
You can, but that is a different plan with its own rules, such as a reversal setup. Buying in a weekly downtrend because a small chart looks strong breaks the logic of top-down analysis.
How often should I repeat the analysis?
Recheck the weekly chart once a week and the daily chart once a day. The entry chart needs attention only when price is near your zone.
Does top-down analysis guarantee better trades?
No. It keeps you from fighting the larger trend and gives each decision a reason, but stops still get hit, so test it on past data and a demo account first.
បន្តរៀន
 ជំពូក 4Why use more than one timeframe?A timeframe is the period each candle on a chart covers, from one minute to one month. One chart shows only one scale, so a rise on the 15-minute chart can be a small bounce inside a daily downtrend. A higher timeframe gives direction and major levels; a lower one gives detail for timing and stops.
 ជំពូក 4Choosing your timeframes.Choose three charts spaced about four to six times apart: a higher trend chart for direction, a middle setup chart where you plan the trade, and a lower entry chart to time the order. Start from the setup chart that fits your holding time. A swing trader might use daily, 4-hour and 1-hour charts.

