Impulse waves: the five-wave move.
An impulse is the five-wave move that carries an Elliott Wave trend: waves 1, 3 and 5 go with the trend and waves 2 and 4 pull back. It must pass three rules: wave 2 never goes past the start of wave 1, wave 3 is never the shortest trend wave, and wave 4 never enters wave 1's price range.
เนื้อหานี้ยังมีเฉพาะภาษาอังกฤษ

In Elliott Wave analysis, a trend moves forward in five waves and then corrects. The five-wave advance is called an impulse, and it must obey three rules. If one rule breaks, the count is wrong, however neat the chart looks.
If the idea of waves is new to you, start with what Elliott Wave theory is. The examples here use round illustrative prices so the arithmetic is easy to follow.
What does a five-wave impulse look like?
Picture a rally on EUR/USD that climbs from 1.0800 to 1.1040 in five legs:
- Wave 1 rises from 1.0800 to 1.0900.
- Wave 2 falls back to 1.0840.
- Wave 3 rises to 1.1000.
- Wave 4 falls back to 1.0940.
- Wave 5 rises to 1.1040.
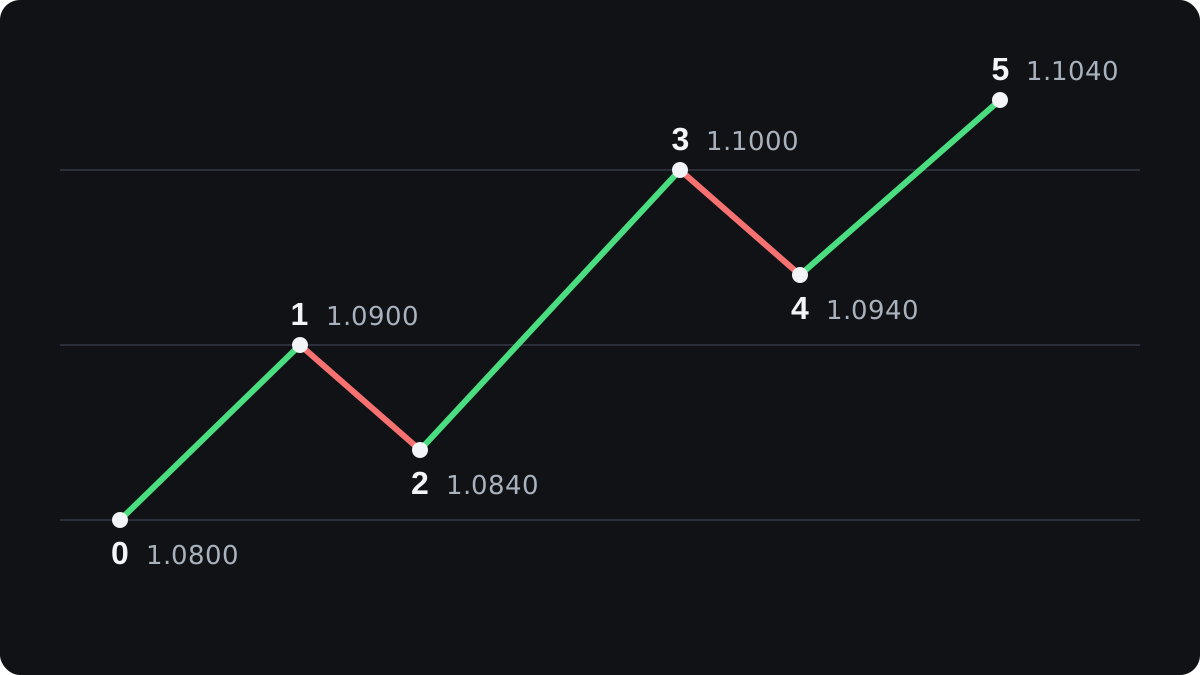
Waves 1, 3 and 5 move with the trend. Waves 2 and 4 move against it and are smaller, so each high sits above the last one and each dip stops above the previous dip.
That pattern of higher highs and higher lows is the same market structure that price action traders read. A falling impulse is the mirror image, with five waves down, lower highs and lower lows.
On a shorter timeframe, each trend wave usually splits into five smaller waves, while waves 2 and 4 usually split into three. Those three-wave shapes are covered in corrective waves.
What are the three rules of an impulse?
Elliott Wave has many guidelines and only a few rules. The rules use price alone, so you can check them with simple subtraction. Measure each wave from its start to its end, in pips.
Rule 1: wave 2 never goes past the start of wave 1
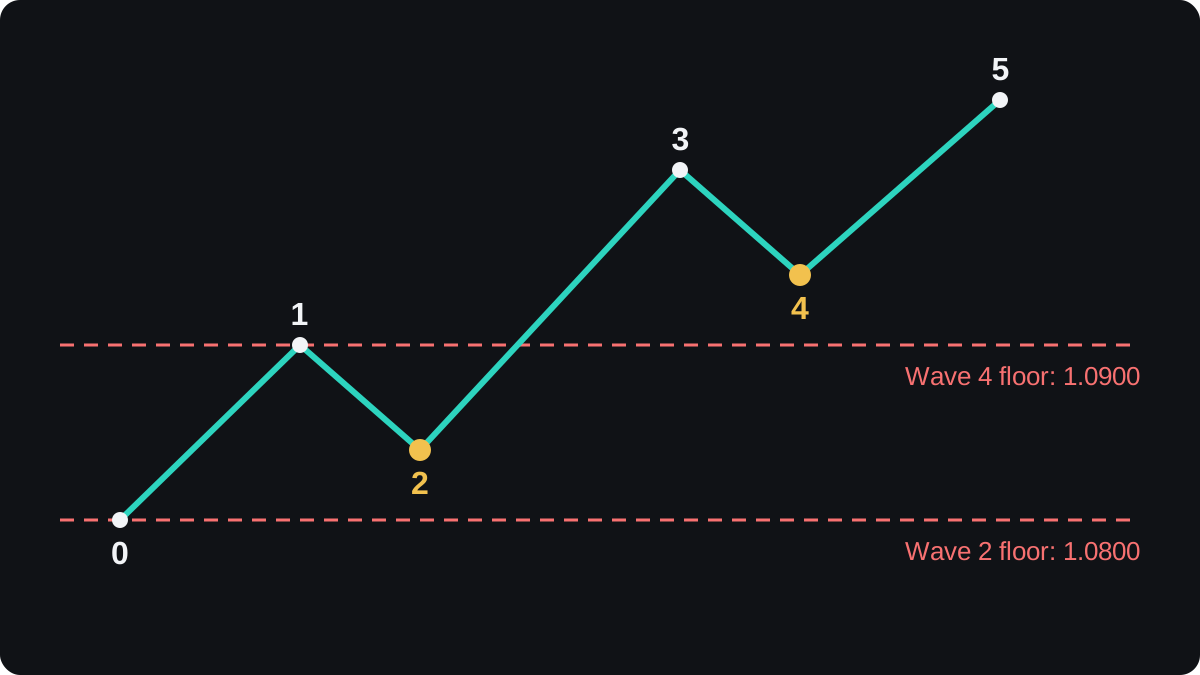
Wave 2 can retrace almost all of wave 1, but never more than 100%. In the example, wave 1 started at 1.0800, so wave 2 had to stay above that price. It stopped at 1.0840, 40 pips clear.
In a falling impulse the rule flips. Wave 2 must stay below the high where wave 1 began.
Rule 2: wave 3 is never the shortest trend wave
Wave 3 does not have to be the longest. It only has to avoid being the shortest of waves 1, 3 and 5. In the example, wave 1 is 100 pips, wave 3 is 160 pips and wave 5 is 100 pips.
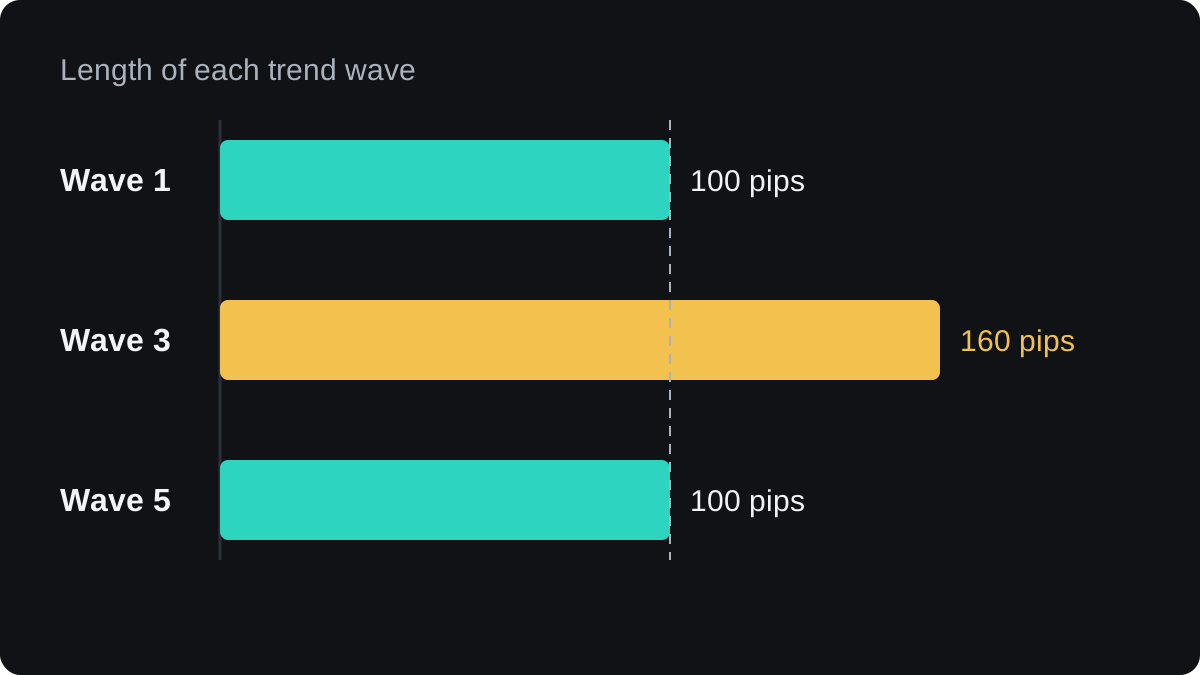
The rule has a consequence that is easy to miss. If wave 3 ends up shorter than wave 1, then wave 5 must be shorter than wave 3, and a long fifth wave would break the count.
Rule 3: wave 4 never enters the price range of wave 1
Wave 4 must not trade into the ground covered by wave 1. In a rally, that means the low of wave 4 stays above the high of wave 1. Here wave 1 topped at 1.0900 and wave 4 bottomed at 1.0940.
Together, rules 1 and 3 give each pullback a floor. While the count is right, price stays above it.
There is one recognised exception to rule 3. A diagonal is a wedge-shaped five-wave move that can appear in the wave 1 or wave 5 position, and inside a diagonal wave 4 is allowed to overlap wave 1.
Checking a count step by step
Take the five prices from the example and test them in order. On EUR/USD one pip is 0.0001, so a gap of 0.0100 is 100 pips.
- Wave 1: 1.0900 minus 1.0800 is 0.0100, which is 100 pips.
- Wave 2: 1.0900 minus 1.0840 is 0.0060, a 60 pip pullback. Its low of 1.0840 is above 1.0800, so rule 1 passes.
- Wave 3: 1.1000 minus 1.0840 is 0.0160, which is 160 pips.
- Wave 4: 1.1000 minus 1.0940 is 0.0060, another 60 pip pullback. Its low of 1.0940 is above the wave 1 high of 1.0900, so rule 3 passes.
- Wave 5: 1.1040 minus 1.0940 is 0.0100, which is 100 pips.
- Compare the trend waves: 100, 160 and 100 pips. The shortest length, 100, belongs to waves 1 and 5, so rule 2 passes.
| Rule | What to check | Example | Result |
|---|---|---|---|
| 1 | Wave 2 low above 1.0800 | 1.0840 | Pass |
| 2 | Wave 3 against 100 and 100 pips | 160 pips | Pass |
| 3 | Wave 4 low above 1.0900 | 1.0940 | Pass |
Suppose wave 4 had dropped to 1.0880 instead. It would sit 20 pips inside the range of wave 1, so rule 3 fails and the move is either a diagonal or a different pattern.
Passing all three rules makes a count allowed, which is a weaker claim than correct. The same chart can often be counted in more than one valid way.
Guidelines that often hold but can break
Elliott Wave texts also describe guidelines, tendencies that shape what analysts expect next. None of them is guaranteed.
An extension is a trend wave much longer than the other two. It is most often wave 3. When wave 3 extends, waves 1 and 5 often come out roughly equal, as they do in the example.
Alternation is the tendency for waves 2 and 4 to differ in shape. If wave 2 is a sharp, deep pullback, wave 4 is often shallow and sideways, and the reverse.
Ratios from Fibonacci retracement are often quoted too. The example was built to sit near common ones. Wave 2 retraced 60 of 100 pips, which is 60%, near 61.8%.
Wave 3 was 160 ÷ 100 = 1.6 times wave 1, near 1.618. Wave 4 retraced 60 of 160 pips, which is 37.5%, near 38.2%.
Real charts rarely land on these ratios exactly, and the evidence that they mark turning points better than chance is weak. Treat them as areas to watch, with no promise that price will react there.
A truncation is a wave 5 that fails to move beyond the end of wave 3, so in a rally it makes no new high.
It is allowed as long as the three rules still hold, and it is usually read as a sign of a tiring trend.
How the rules give you an invalidation price
Each rule names a price where a count is proven wrong. That price is the invalidation level, and it is often the most useful thing a wave count gives you.
In the example, while wave 2 was forming, a drop below 1.0800 would have ruled the count out. Once wave 3 had climbed above 1.0900, the level for wave 4 moved up to that price, the top of wave 1.
A trader working from this count could place a stop loss just beyond the level, since the reason for the trade is gone once price crosses it. This is an illustration, and ways to place a stop loss compares other methods.
Waves are labelled with hindsight. In real time you often cannot tell whether wave 3 is still running or wave 5 has begun, so counts get revised and two analysts can label one chart differently.
Careful tests of Elliott Wave forecasting are scarce, partly because counts are too subjective to test cleanly. Using the rules to define risk rests on firmer ground than using a count to predict.
The lesson on trading with Elliott Wave counts builds on this.
คำถามที่พบบ่อย
What are the three rules of an Elliott impulse wave?
Wave 2 never retraces more than 100% of wave 1. Wave 3 is never the shortest of waves 1, 3 and 5. Wave 4 never enters the price range of wave 1, except inside a diagonal.
Does wave 3 have to be the longest wave?
No. It only has to avoid being the shortest of the three trend waves. It is often the longest, but a count where wave 1 or wave 5 is longer can still be valid.
What happens if wave 4 overlaps wave 1?
The move is not a standard impulse. It may be a diagonal, or the waves may need to be counted another way, often as part of a correction.
Can an impulse wave go down?
Yes. A falling impulse has five waves down with the rules mirrored: wave 2 stays below the start of wave 1, and wave 4 stays below the low of wave 1.
How many waves are in a full Elliott cycle?
Usually eight: a five-wave impulse followed by a three-wave correction labelled A, B and C.
เรียนต่อ
 บทที่ 2What is Elliott Wave theory?Elliott Wave theory says prices move in repeating patterns driven by crowd mood. A trend unfolds in five waves, three with the trend and two against it, then corrects in three waves labelled A, B and C. The same pattern appears at every scale. Counting waves is subjective, and evidence that it predicts prices is weak.
 บทที่ 2Corrective waves: zigzags, flats and triangles.Corrective waves are the moves against the trend in Elliott Wave theory, labelled with letters. The three basic shapes are the zigzag (5-3-5, sharp and deep), the flat (3-3-5, sideways, with wave B retracing about 90% of A or more) and the triangle (five legs, A to E, usually narrowing). Corrections can also join into combinations.
 บทที่ 2Trading with Elliott Wave counts.Trading with an Elliott Wave count means using the labels to set three prices: an entry after a correction ends, a stop at the level where the count breaks a rule, and a target from Fibonacci guidelines. Counts are subjective and change often, so the invalidation level matters more than the forecast.

