What candle bodies and wicks tell you.
A candle's body shows the move from open to close, and its wicks show prices reached but not kept. A long body means price moved far and held it; a short body means open and close ended near each other. A long lower wick shows a drop bought back, and a long upper wick a rise sold off.
Nội dung này hiện chỉ có bản tiếng Anh.

A candle's colour tells you whether price closed up or down. Its shape tells you more. One hourly candle climbs and closes near its high, while another falls hard and wins back most of the drop before the hour ends.
The difference is in the proportions: how much of each candle is body and how much is wick. This lesson measures each part in pips and reads what the sizes suggest about buying and selling pressure.
How do you measure a body and its wicks?
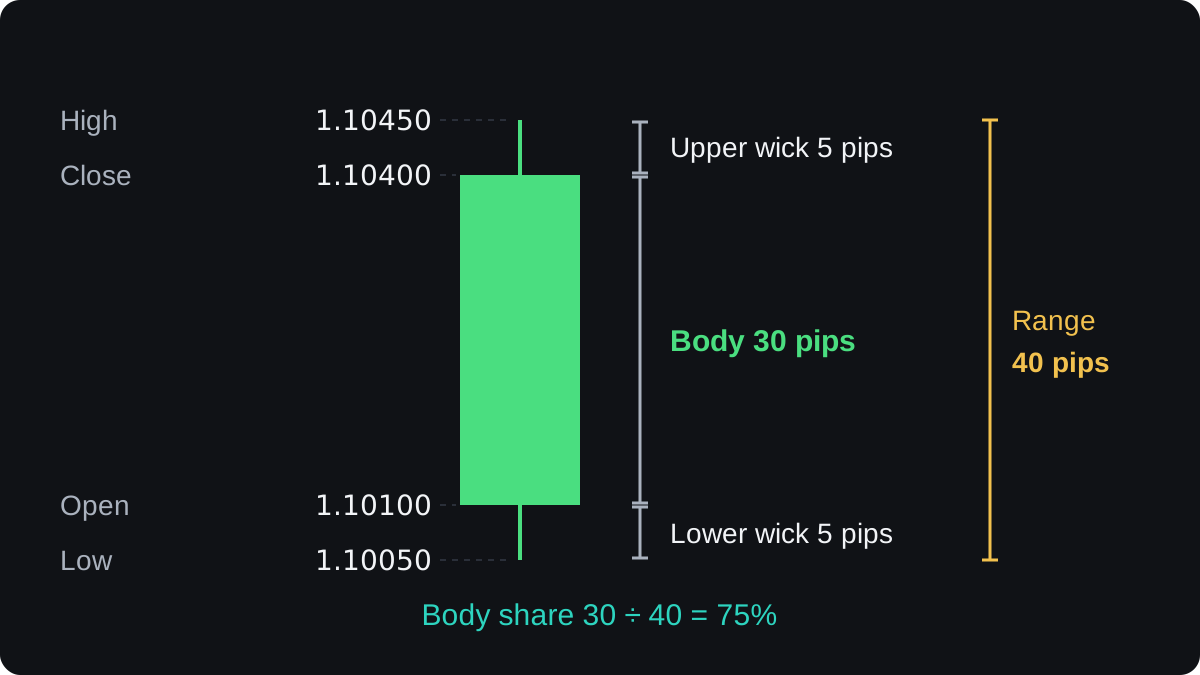
Start with an hourly EUR/USD candle, using round illustrative prices. It opens at 1.10100, trades as high as 1.10450 and as low as 1.10050, and closes at 1.10400.
The body is the thick part between the open and the close, as in how to read a candlestick. The wicks, also called shadows, are the thin lines above and below it. They reach the high and the low.
On this pair a pip is 0.0001. Here is each part in pips:
- Body: close minus open, ignoring the sign. 1.10400 minus 1.10100 = 0.00300, which is 30 pips.
- Upper wick: high minus the higher of open and close. 1.10450 minus 1.10400 = 0.00050, which is 5 pips.
- Lower wick: the lower of open and close minus the low. 1.10100 minus 1.10050 = 0.00050, which is 5 pips.
- Range: high minus low. 1.10450 minus 1.10050 = 0.00400, which is 40 pips. The parts add up: 30 + 5 + 5 = 40.
- Body share: body ÷ range × 100. 30 ÷ 40 × 100 = 75%.
The body share lets you compare candles of different sizes on one scale. At 75%, this candle ended far from where it opened and close to its high.
What does a long or short body suggest?
A long body means price travelled a long way between the open and the close and kept most of the move. The EUR/USD candle rose 30 pips from its open and closed only 5 pips below its high.
A long up body is usually read as buying pressure, and a long down body as selling pressure. Either way, it describes that hour only. It does not tell you what the next hour will do.
A short body means the open and the close ended near each other. Price may have stayed in a narrow band, or it may have swung widely and come back. The wicks tell you which.
A short body with short wicks is a quiet period. A short body with long wicks on both sides is a busy period in which neither side kept control.
The spinning top and marubozu lesson gives these shapes their names. When the body shrinks to almost nothing, the candle is a doji.
There is no standard line between long and short. One rule of thumb is to call a body share above two thirds long and below one third short. Apply whatever numbers you choose the same way every time.
What does a long wick suggest?
A wick marks prices the market reached during the period but did not keep. The longer the wick, the further price went before it came back.
A long lower wick means price dropped during the period and recovered before the close, which is read as buyers stepping in. A long upper wick is the mirror image: price rose and was sold back down.
Talk of buyers and sellers here is shorthand. The chart only shows that prices at the extreme did not hold.
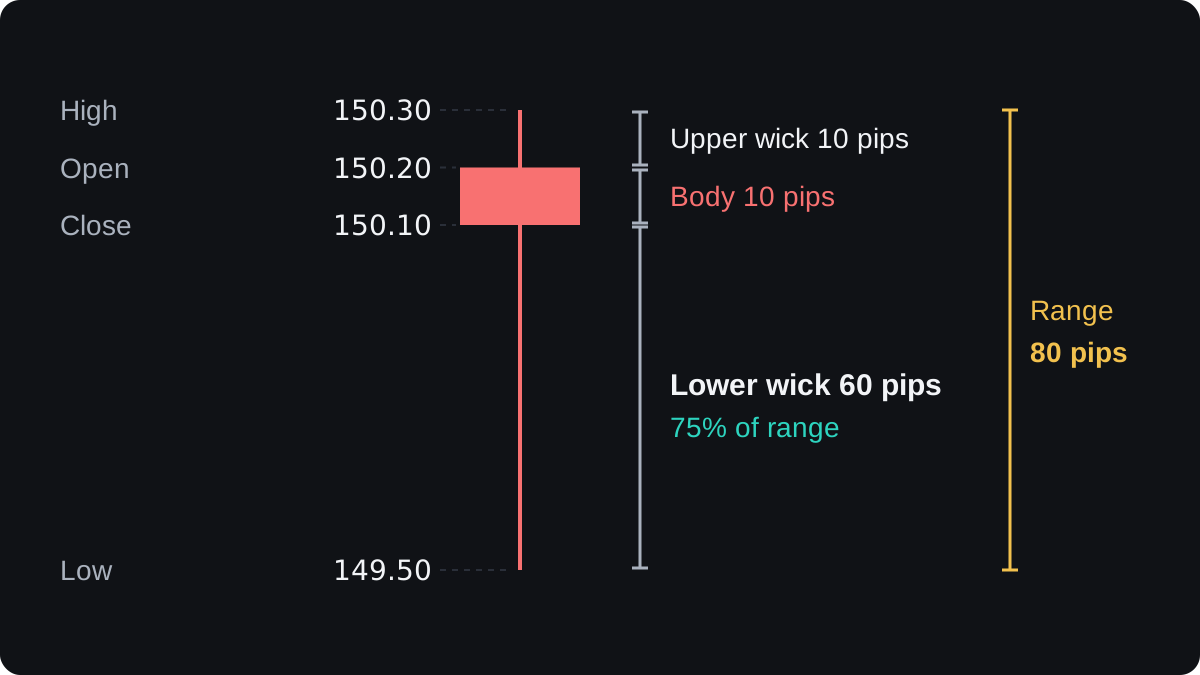
On yen pairs a pip is 0.01. Take an hourly USD/JPY candle, again with illustrative prices: it opens at 150.20, has a high of 150.30 and a low of 149.50, and closes at 150.10.
- Body: 150.20 minus 150.10 = 0.10, which is 10 pips. The close is below the open, so the body is bearish.
- Upper wick: 150.30 minus 150.20 = 0.10, which is 10 pips.
- Lower wick: 150.10 minus 149.50 = 0.60, which is 60 pips.
- Range: 150.30 minus 149.50 = 0.80, which is 80 pips. Check: 10 + 10 + 60 = 80.
- Lower wick share: 60 ÷ 80 × 100 = 75%.
The body is red and small, yet three quarters of the candle hangs below it. At some point in the hour price traded 70 pips below the open, and by the close it was only 10 pips below.
Side by side, the two example candles compare like this:
| Measure | EUR/USD candle | USD/JPY candle |
|---|---|---|
| Body | 30 pips, up | 10 pips, down |
| Upper wick | 5 pips | 10 pips |
| Lower wick | 5 pips | 60 pips |
| Range | 40 pips | 80 pips |
| Body share | 75% | 12.5% |
Location changes what a wick is worth. A long lower wick after a fall, at a price that held before, is the starting point of the hammer pattern.
Near a support or resistance level, a long wick shows price testing that level and failing to stay beyond it. In the middle of a range, the same wick has no level to test.
Why size only means something next to other candles
A 40 pip hour can be large on a quiet EUR/USD day and ordinary during a busy news release. So compare each candle with the ones just before it, on the same chart and timeframe.
Suppose the four hourly candles before the EUR/USD example each had a range of 15 pips. The 40 pip candle is then 40 ÷ 15 = about 2.7 times the recent size.
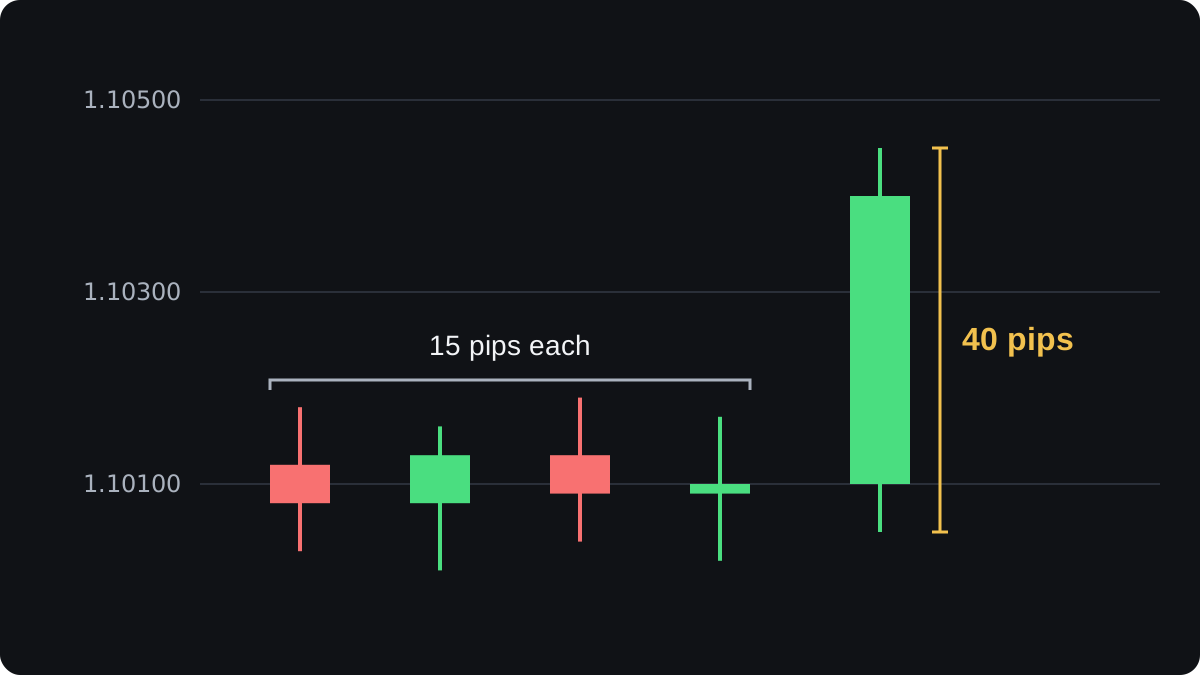
A simple habit is to scan the last 10 to 20 candles and ask whether the one you are reading is larger or smaller than usual. The volatility lesson covers tools that measure typical range, such as the Average True Range.
Timeframe changes the picture as well. Four 15-minute candles make one hourly candle, which keeps only the first open, the last close, the highest high and the lowest low.
So a long wick on an hourly candle could be one spike lasting a few minutes, or a slow drift lasting most of the hour. Switch to a lower timeframe when the difference matters to you.
Where reading bodies and wicks falls short
A candle is a summary of four prices, and a lot of detail is lost in that summary.
Buying pressure and selling pressure are interpretations. Spot forex has no central exchange, so a candle cannot show who traded or how much. MetaTrader usually shows tick volume for forex, a count of price updates.
Wicks can differ between brokers. Each broker draws charts from its own price feed, and MetaTrader charts are normally built from bid prices.
A spike on one platform can be shorter or missing on another. The lesson on where broker prices come from explains why.
News releases can print long wicks within seconds when few orders are waiting near the price. A wick like that may reflect a brief shortage of orders, and it can mean little once the market settles.
Evidence that single candle shapes predict forex moves is weak and mixed. Treat a body or a wick as one clue next to the trend and nearby levels, and test any rule on past data first.
Câu hỏi thường gặp
What does a long wick on a candle mean?
It means price reached that level during the period but did not stay there. A long lower wick shows a drop that was bought back, and a long upper wick shows a rise that was sold.
Is a big candle body bullish?
Only if the candle closed above its open. A big body shows a strong move in whichever direction it closed, and it describes the past period, so it is no guarantee the next candle moves the same way.
What is the difference between a wick and a shadow?
There is none. Wick and shadow are two names for the thin lines above and below the body, marking the high and the low of the period.
How do you measure a wick in pips?
For the upper wick, subtract the higher of the open and close from the high. For the lower wick, subtract the low from the lower of the open and close.
Divide either result by the pip size, 0.0001 on most pairs and 0.01 on yen pairs.
Does the timeframe change what a candle shows?
Yes. A higher timeframe candle merges several smaller ones, so a long wick on an hourly chart may be a brief spike that you can only see on a 5 or 15 minute chart.
Học tiếp
 Chương 2How to read a candlestick.A candlestick shows four prices for one trading period: the open, high, low and close. The thick body runs from open to close, and the thin wicks reach the high and the low. A candle that closed above its open is bullish, usually green, and one that closed below is bearish, usually red.
 Chương 2Spinning tops and marubozu candles.A spinning top is a candle with a small body and wicks on both sides longer than the body, showing that buyers and sellers ended the period roughly even. A marubozu is the opposite: a long body with little or no wick, showing one side controlled the period from open to close. Neither predicts the next move alone.
 Chương 2Doji candles and what they signal.A doji is a candle that opens and closes at almost the same price, so its body is a thin line. It shows buyers and sellers ended the period even. The four common types are standard, long-legged, dragonfly and gravestone. A doji alone is a weak signal; context and the next candle matter.
 Chương 2Hammer and hanging man patterns.A hammer and a hanging man are the same candle: a small body near the top and a lower wick at least twice as long. After a fall it is a hammer, a hint that selling may be fading. After a rise it is a hanging man, a warning that buying may be tiring. Each needs a confirming next candle.
 Chương 2Inverted hammer and shooting star patterns.An inverted hammer and a shooting star are the same candle: a small body near the low and a long upper wick, usually at least twice the body. After a fall it is an inverted hammer, a possible turn up. After a rise it is a shooting star, a possible turn down. Both need a confirming close.
 Chương 2Bullish and bearish engulfing patterns.An engulfing pattern is a two-candle reversal signal. A bullish engulfing forms after a decline, when a rising candle's body completely covers the previous falling candle's body. A bearish engulfing is the mirror image after a rise. It suggests control has switched sides, but it often fails in ranges and means more at a support or resistance level.
 Chương 2Tweezer tops and bottoms.A tweezer top is two candles, usually side by side, that reach almost the same high after a rise. A tweezer bottom is two candles with almost the same low after a fall. Both show a price the market rejected twice. They mean most at a known level and are weak signals on their own.
 Chương 2Morning star and evening star patterns.A morning star is a three-candle pattern at the end of a fall: a long bearish candle, a small-bodied star near the low, then a long bullish candle that closes above the first candle's midpoint. An evening star is the mirror image after a rise. Both suggest a possible reversal, and neither guarantees one.
 Chương 2Three white soldiers and three black crows.Three white soldiers is three bullish candles in a row after a decline, each closing higher and near its high. Three black crows is the bearish mirror after a rise. Both suggest one side has taken control, but they often appear after a large move, can fail, and are best read with the trend and a planned stop.
 Chương 2Three inside up and three inside down.Three inside up is a three-candle bullish reversal pattern: a long bearish candle, a small bullish candle whose body sits inside it, then a bullish candle that closes above the first candle's open. Three inside down is the mirror image after a rise. Both are a harami plus a confirming candle, and neither is a reliable signal on its own.
 Chương 2Candlestick patterns cheat sheet.A candlestick pattern is a shape made by one, two or three candles that hints at who controlled price. Single candles such as the doji, hammer and shooting star show rejection or indecision. Two- and three-candle patterns such as engulfing and morning star show a shift. None predicts price reliably on its own.

