Spinning tops and marubozu candles.
A spinning top is a candle with a small body and wicks on both sides longer than the body, showing that buyers and sellers ended the period roughly even. A marubozu is the opposite: a long body with little or no wick, showing one side controlled the period from open to close. Neither predicts the next move alone.
Some candles close almost where they opened, with long wicks on both sides. Others run from one end of their range to the other with almost no wick.
The first shape is a spinning top and the second is a marubozu. Both are easy to measure in pips, and both are easy to over-read.
What does a spinning top look like?
Picture an hour on EUR/USD. Price rises 12 pips above the open, falls 12 pips below it, then recovers to close just 3 pips higher than it opened.
The candle for that hour has a short body and a wick sticking out of each end. If the parts of a candle are new to you, start with how to read a candlestick.
That shape is a spinning top: a candle with a small body and upper and lower wicks that are each longer than the body. The body colour carries little weight, because the gap between open and close is so small.
Both sides pushed price a fair distance during the period, and neither held its ground by the close. As the body and wick lesson explained, the body shows the net move and the wicks show prices that were reached and then rejected.
No official limit defines a small body. This lesson uses a working rule you can change: a body under 30% of the candle's full range, with both wicks longer than the body.
How do you measure a spinning top?
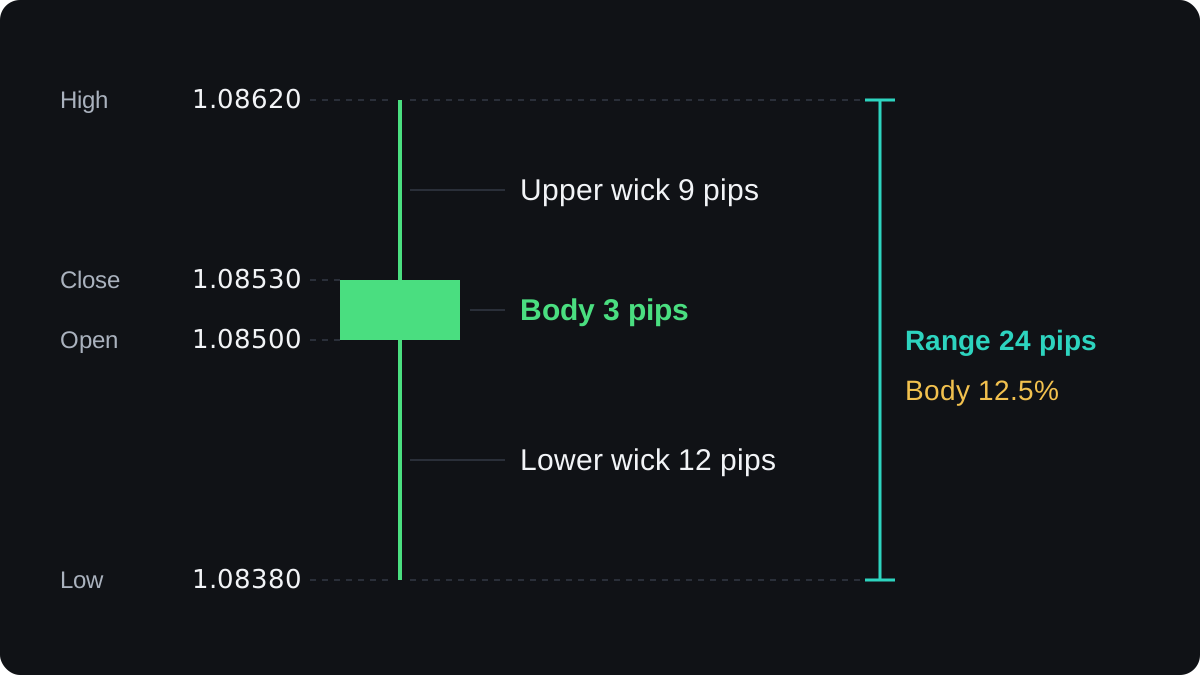
Take that EUR/USD hour with round illustrative prices: open 1.08500, high 1.08620, low 1.08380, close 1.08530. On this pair a pip is 0.0001.
- Range is the high minus the low: 1.08620 minus 1.08380 = 0.00240, which is 24 pips.
- Body is the close minus the open: 1.08530 minus 1.08500 = 0.00030, which is 3 pips.
- Upper wick is the high minus the higher of open and close: 1.08620 minus 1.08530 = 0.00090, which is 9 pips.
- Lower wick is the lower of open and close minus the low: 1.08500 minus 1.08380 = 0.00120, which is 12 pips.
- Check the parts: 9 + 3 + 12 = 24 pips, the full range.
- Body share is 3 ÷ 24 = 0.125, or 12.5% of the range.
The body is well under 30%, and both wicks are longer than the 3 pip body, so the candle passes as a spinning top.
A doji is the extreme case, where open and close are equal or almost equal. The doji lesson comes next, and where a small body ends and no body begins depends on the threshold you choose.
What is a marubozu?
Now take an hour on USD/JPY. It opens at 150.00, dips to 149.98, then climbs steadily and closes at 150.60, just under the high of 150.62. The candle is almost all body.
A marubozu is a candle with a long body and little or no wick at either end. The word is Japanese and is usually translated as something close to a shaved head, which suits a candle with nothing sticking out.
In its strict form, a bullish marubozu opens exactly at the low and closes exactly at the high. Real price feeds rarely give a perfect zero, so tiny wicks are normally accepted.
On a JPY pair a pip is 0.01, so the sums are:
- Range: 150.62 minus 149.98 = 0.64, which is 64 pips.
- Body: 150.60 minus 150.00 = 0.60, which is 60 pips.
- Upper wick: 150.62 minus 150.60 = 0.02, which is 2 pips.
- Lower wick: 150.00 minus 149.98 = 0.02, which is 2 pips.
- Body share: 60 ÷ 64 = 0.9375, about 94% of the range.
This lesson calls a candle a marubozu when the body fills at least 90% of the range. The cut-off is a choice, so pick yours and keep it fixed when you compare charts.
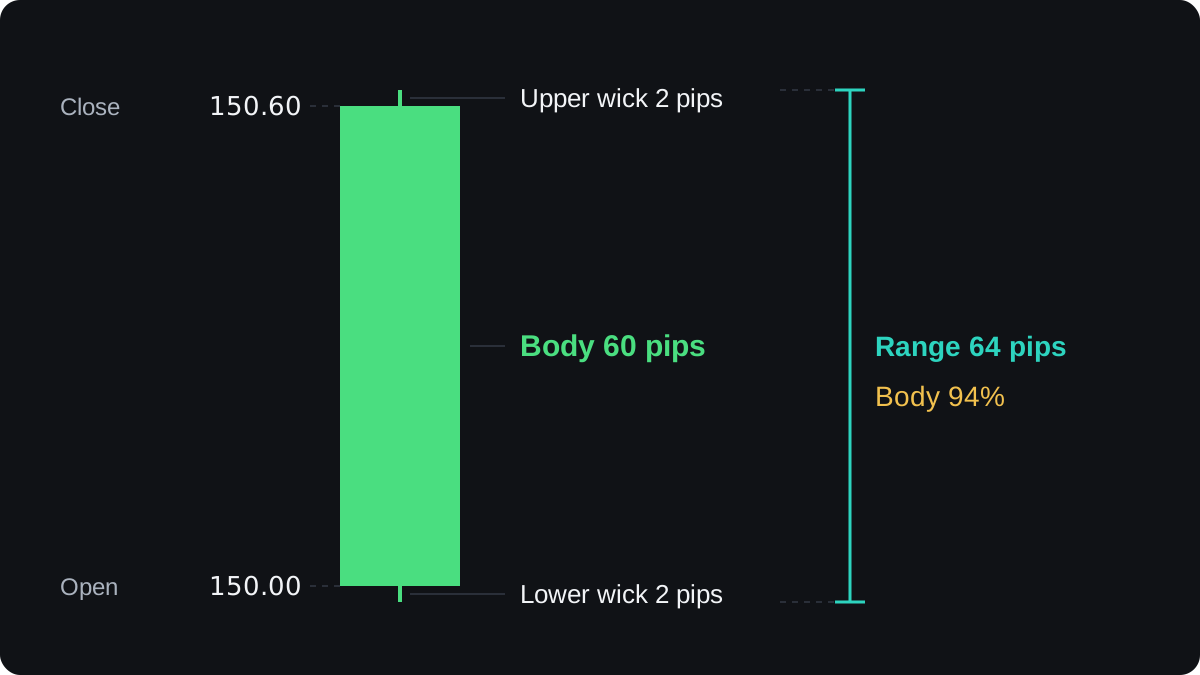
Buyers held control for the whole hour. The only dip was 2 pips deep, and the close sat 2 pips from the top. Against the spinning top's 12.5%, a body share of about 94% records the opposite kind of hour.
How do bullish and bearish marubozu candles differ?
A bearish marubozu is the mirror image. It opens at or near the high and closes at or near the low, so sellers controlled the period from start to finish.
Some charting books also split the marubozu by which end has no wick. One with no wick at the open end is often called an opening marubozu, and one with no wick at the close end a closing marubozu.
Those names vary between sources, so check what a book or tool means before you rely on them. The close end usually gets more attention, because the close is the last price the period settled on.
| Candle | Body share (this lesson's rule) | Wicks | What it records |
|---|---|---|---|
| Spinning top | Under 30% of range | Both longer than the body | Both sides moved price, neither held it |
| Bullish marubozu | 90% or more, close near the high | Tiny or none | Buyers in control from open to close |
| Bearish marubozu | 90% or more, close near the low | Tiny or none | Sellers in control from open to close |
Why does context decide what these candles mean?
A spinning top in the middle of a sideways market is one more undecided period among many. It adds almost nothing to what the chart already shows.
The same candle after a run of strong bullish candles says more. Buyers who had won period after period could not move the close much higher this time, so the rise has stalled for at least one period.
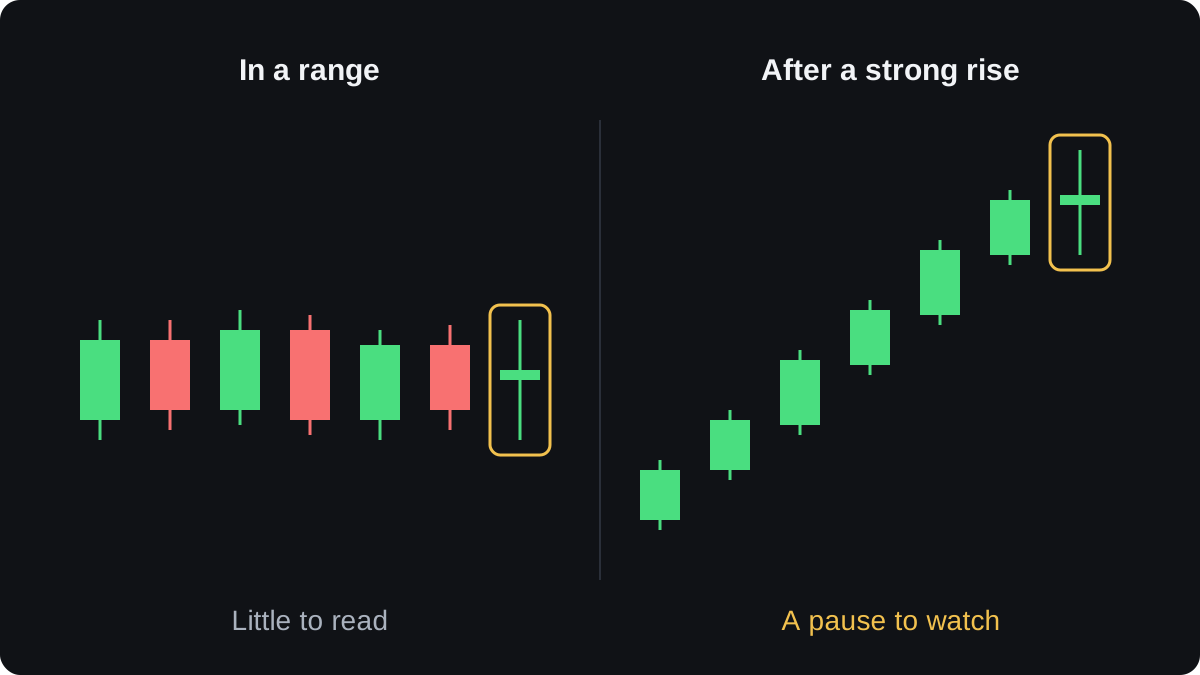
A stall can turn into a reversal, or it can be a short rest before the trend carries on. Treat the spinning top as a question, and let the next one or two candles answer it.
Location adds weight. A spinning top at a price where the market has turned before, the idea behind support and resistance, deserves more attention than one in open space.
A marubozu follows the same logic. One that breaks out of a tight range shows a strong push in that direction.
One that arrives after many large candles in the same direction may mean the move is stretched. The next candles can then show profit taking.
Where do these candles mislead you?
Daily candles depend on when your broker starts its trading day. Forex trades around the clock on weekdays, so a broker that ends its day at 17:00 New York time draws different daily candles from one that uses midnight UTC.
The same day can therefore show a spinning top on one platform and an ordinary candle on another. Compare daily patterns only on charts with the same day boundary.
Short timeframes add noise. On a one-minute chart a marubozu can form from a handful of price changes in a quiet moment, and it carries far less information than a daily marubozu built from a full day of trading.
News releases can print a marubozu in seconds. A large candle on a data surprise shows that price jumped, and it gives no guarantee that the jump will last.
Wicks also depend on the price feed. A brief spike in one broker's prices can add a wick that another feed never shows, which can turn a marubozu into a normal candle.
Published tests of single candlestick patterns give mixed results, and those results change with the market, the period studied and the costs assumed.
If you want to rely on either candle, backtest your exact rule first and plan your stop loss before you enter.
Questions
Is a spinning top bullish or bearish?
On its own it is neither. It records a period where neither side held control, and the body colour means little because the body is so small, so the trend and price level around it decide how you read it.
What is the difference between a spinning top and a doji?
Both have wicks on each side. A spinning top has a small but visible body, while a doji opens and closes at or almost at the same price, so its body is close to a thin line.
Does a marubozu mean the trend will continue?
It shows that one side controlled that period from open to close. Prices can still reverse afterwards, especially after a news spike or a long stretched move.
How big must a marubozu body be?
No official threshold exists. This lesson uses 90% of the range as a working rule, and whatever rule you choose, apply it the same way every time.
Keep learning
 Chapter 2How to read a candlestick.A candlestick shows four prices for one trading period: the open, high, low and close. The thick body runs from open to close, and the thin wicks reach the high and the low. A candle that closed above its open is bullish, usually green, and one that closed below is bearish, usually red.
 Chapter 2What candle bodies and wicks tell you.A candle's body shows the move from open to close, and its wicks show prices reached but not kept. A long body means price moved far and held it; a short body means open and close ended near each other. A long lower wick shows a drop bought back, and a long upper wick a rise sold off.
 Chapter 2Doji candles and what they signal.A doji is a candle that opens and closes at almost the same price, so its body is a thin line. It shows buyers and sellers ended the period even. The four common types are standard, long-legged, dragonfly and gravestone. A doji alone is a weak signal; context and the next candle matter.
 Chapter 2Hammer and hanging man patterns.A hammer and a hanging man are the same candle: a small body near the top and a lower wick at least twice as long. After a fall it is a hammer, a hint that selling may be fading. After a rise it is a hanging man, a warning that buying may be tiring. Each needs a confirming next candle.
 Chapter 2Inverted hammer and shooting star patterns.An inverted hammer and a shooting star are the same candle: a small body near the low and a long upper wick, usually at least twice the body. After a fall it is an inverted hammer, a possible turn up. After a rise it is a shooting star, a possible turn down. Both need a confirming close.
 Chapter 2Bullish and bearish engulfing patterns.An engulfing pattern is a two-candle reversal signal. A bullish engulfing forms after a decline, when a rising candle's body completely covers the previous falling candle's body. A bearish engulfing is the mirror image after a rise. It suggests control has switched sides, but it often fails in ranges and means more at a support or resistance level.
 Chapter 2Tweezer tops and bottoms.A tweezer top is two candles, usually side by side, that reach almost the same high after a rise. A tweezer bottom is two candles with almost the same low after a fall. Both show a price the market rejected twice. They mean most at a known level and are weak signals on their own.
 Chapter 2Morning star and evening star patterns.A morning star is a three-candle pattern at the end of a fall: a long bearish candle, a small-bodied star near the low, then a long bullish candle that closes above the first candle's midpoint. An evening star is the mirror image after a rise. Both suggest a possible reversal, and neither guarantees one.
 Chapter 2Three white soldiers and three black crows.Three white soldiers is three bullish candles in a row after a decline, each closing higher and near its high. Three black crows is the bearish mirror after a rise. Both suggest one side has taken control, but they often appear after a large move, can fail, and are best read with the trend and a planned stop.
 Chapter 2Three inside up and three inside down.Three inside up is a three-candle bullish reversal pattern: a long bearish candle, a small bullish candle whose body sits inside it, then a bullish candle that closes above the first candle's open. Three inside down is the mirror image after a rise. Both are a harami plus a confirming candle, and neither is a reliable signal on its own.
 Chapter 2Candlestick patterns cheat sheet.A candlestick pattern is a shape made by one, two or three candles that hints at who controlled price. Single candles such as the doji, hammer and shooting star show rejection or indecision. Two- and three-candle patterns such as engulfing and morning star show a shift. None predicts price reliably on its own.

