Candle signals at key levels.
A candle signal is a candle whose shape tells you how buyers and sellers behaved at a price. Pin bars, inside bars and engulfing candles carry more weight at a support or resistance level you marked in advance, in the direction of the wider structure. Away from a level they mean little, and even at one they can fail.
Nội dung này hiện chỉ có bản tiếng Anh.

A long wick on a chart is easy to find. One that forms right at a support level you marked yesterday is rarer, and it tells you more.
The previous lesson showed how to mark support and resistance. This one adds the candle that forms when price reaches one of those levels.
Why does location matter more than shape?
A candle records four prices for one period: open, high, low and close. If those are new to you, how to read a candlestick covers them first.
The shape shows how buyers and sellers fought during that period. In the middle of a range the fight has no clear meaning, because no level was being tested.
At a level, the same shape answers a question. Did price get pushed back from support, or did sellers break through? The candle shows the answer for that one period.
The wider market structure adds context. A bullish signal at support, in a market making higher lows, points the same way as the trend.
Timeframe matters as well. A daily candle sums up a full day of trading, so it reflects far more activity than a five minute candle of the same shape.
What is a pin bar?
A pin bar is a candle with a small body and one long wick: price pushed hard in one direction, then closed back near where it started. The long wick points at the side that was rejected.
A bullish pin bar has its long wick below, and a bearish one has it above. A hammer is one named example of a bullish pin bar, covered in hammer and hanging man.
There is no official size rule. A common rule of thumb is a wick at least twice the length of the body, with the body in the top or bottom third of the range.
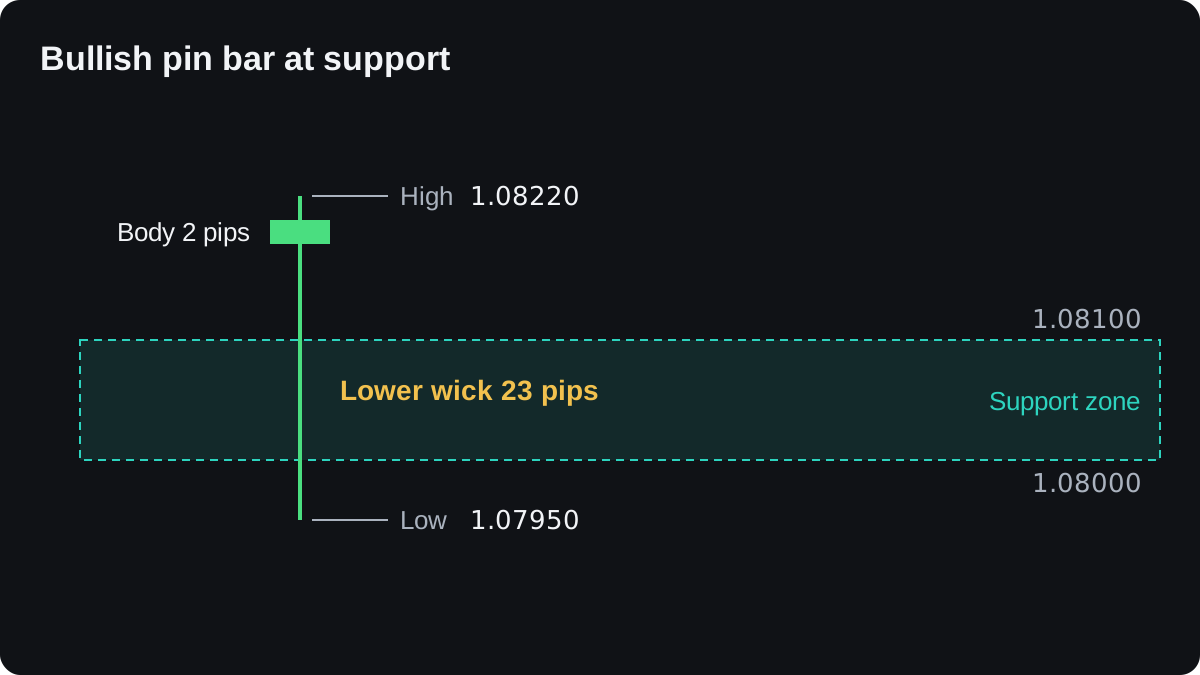
Say EUR/USD has support marked between 1.08000 and 1.08100. A daily candle opens at 1.08180, falls to 1.07950, then climbs to close at 1.08200. Its high is 1.08220.
Measure it in pips, which are 0.0001 on this pair:
- Body: 1.08200 minus 1.08180 = 2 pips.
- Lower wick: 1.08180 minus 1.07950 = 23 pips.
- Upper wick: 1.08220 minus 1.08200 = 2 pips.
- Full range: 1.08220 minus 1.07950 = 27 pips.
The lower wick is 23 of 27 pips, about 85% of the range. Price dipped below the zone during the day and was pushed back above it by the close.
What is an inside bar?
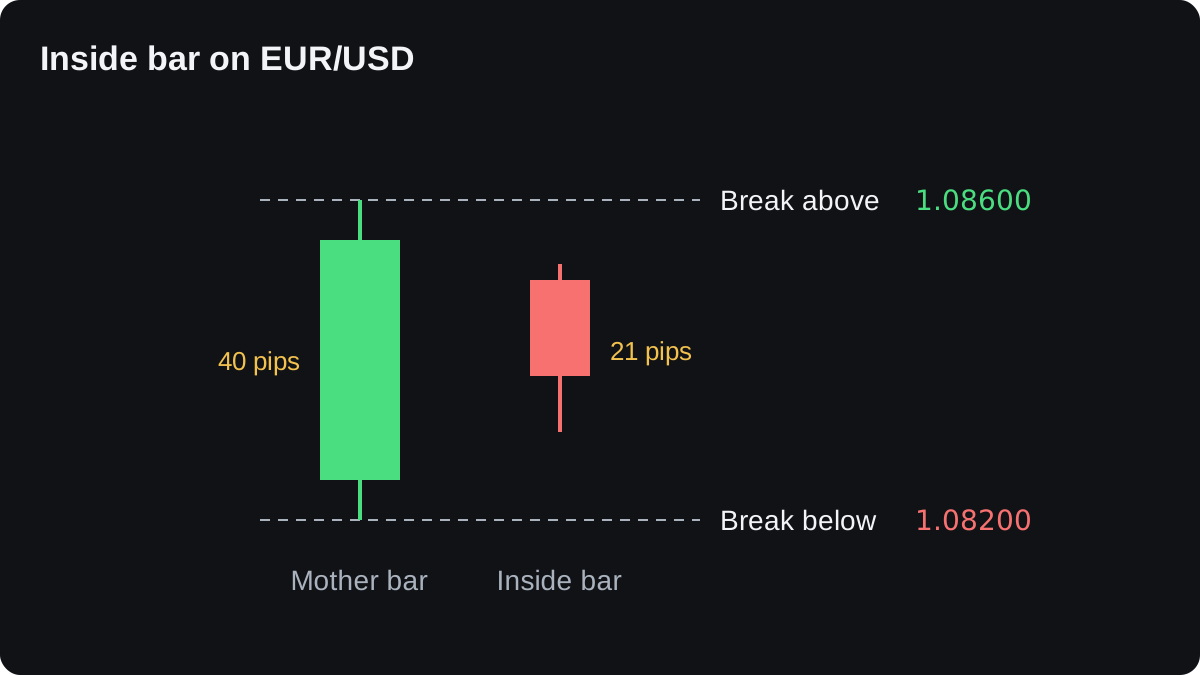
Picture a wide candle followed by a quieter one that stays within its high and low. The second candle is an inside bar, and the wide one before it is often called the mother bar.
An inside bar shows a pause. The market has stopped extending the previous move for now, and the question is which side gives way first.
Take a mother bar on EUR/USD with a high of 1.08600 and a low of 1.08200, a range of 40 pips. The next candle trades between 1.08520 and 1.08310, a range of 21 pips, so it is an inside bar.
The usual reading is to wait for price to leave the mother bar's range. A move above 1.08600 favours buyers and a move below 1.08200 favours sellers.
At a support or resistance level, the break that agrees with the level carries more weight.
Some definitions also count a candle whose high or low exactly equals the mother bar's. Choose your rule before you look at a chart, so you do not bend it to fit what you see.
What does an engulfing candle show at a level?
An engulfing candle has a body that covers the whole body of the candle before it, in the opposite colour. A bearish one at resistance shows sellers taking back all of the previous period's gain, and more.
Here is one near resistance at 1.08800. A candle opens at 1.08700 and closes at 1.08780. The next opens at 1.08780 and closes at 1.08660, so its body covers the first body completely.
Forex trades around the clock on weekdays, so a new candle usually opens at about the previous close. That is why the forex version of the rule compares bodies only and does not expect a gap.
Size matters too. An engulfing candle that is barely bigger than its neighbours shows a weaker shift than one twice their size. The engulfing patterns lesson covers the bullish and bearish versions in detail.
How do you turn a pin bar into a trade plan?
A signal tells you where the idea starts and also where it is proven wrong. Here is one way to plan the pin bar above, with round illustrative numbers.
It shows the arithmetic only and is no recommendation to take the trade.
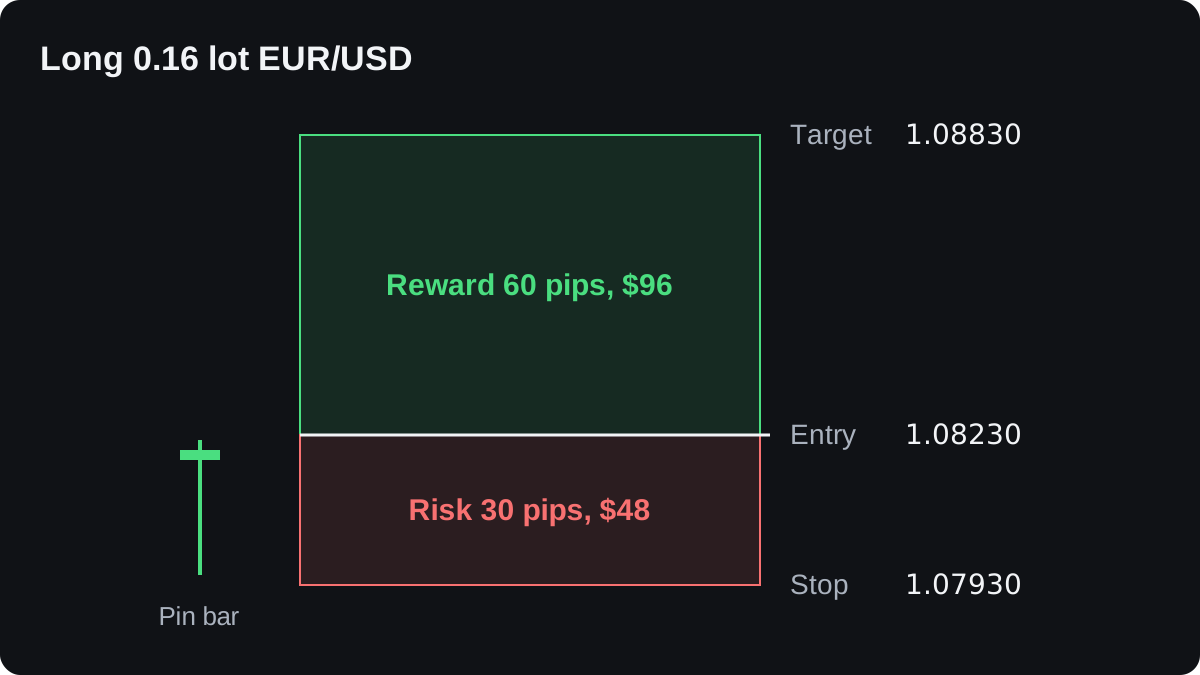
- Entry: a buy stop 1 pip above the high, at 1.08230. If price never trades above the pin bar, no trade opens.
- Stop loss: 2 pips below the low, at 1.07930. The risk is 1.08230 minus 1.07930 = 0.00300, or 30 pips.
- Target: the last swing high at 1.08830, which is 1.08830 minus 1.08230 = 60 pips away. That is 2 pips of reward for each pip of risk.
- Account: $5,000, risking 1% per trade as an illustration, which is $50.
- Size: one standard lot of EUR/USD is worth $10 per pip, so 30 pips risk $300 per lot. $50 ÷ $300 = 0.167 lot, rounded down to 0.16 lot.
- Check: at 0.16 lot a pip is worth $1.60. The stop risks 30 × $1.60 = $48 and the target pays 60 × $1.60 = $96.
These sums leave out the spread and any commission, which make the win a little smaller and the loss a little larger. The position size lesson and the lot size calculator repeat step 5 for any pair.
Where do candle signals fail?
A candle covers one period. It cannot show you the orders waiting beyond the level or the news due tomorrow, and a pin bar formed an hour before a central bank decision can be erased by the release.
Levels are zones, and traders draw them differently. A wick that looks like a clean rejection on your chart may sit a few pips short of the level someone else is watching.
Strong trends run over signals that point the other way. A bullish pin bar at support, in a market making lower highs and lower lows, has the whole structure working against it.
The evidence for candle patterns is also weak. Published tests have given mixed results, and no pattern has shown a win rate you can count on, before or after costs.
Treat a signal as a reason to look closer, with the stop where the idea is proven wrong.
Sometimes price pushes through the level and keeps going. That is a possible breakout, the subject of the next lesson.
Câu hỏi thường gặp
Is a pin bar the same as a hammer?
A hammer is a bullish pin bar that forms after a fall, with a long lower wick and a small body near the top. Pin bar is the broader price action term and covers both directions.
Which timeframe is best for candle signals?
No timeframe suits everyone. Daily candles give fewer signals, each summing up more trading, while short timeframes give many more signals that are easier to wipe out.
Do I need confirmation after a pin bar?
You can wait for price to break the pin bar's high or low before entering, as the buy stop in the example does. Waiting filters out some failed signals, but it gives a worse entry price when the move does come.
How reliable are candle signals at support and resistance?
There is no fixed success rate. Results depend on the market, the timeframe, your exact rules and your costs, so test your rules on a demo account before you trust them.
Học tiếp
 Chương 1What is price action trading?Price action trading means deciding when to buy or sell from the price chart itself: the swing highs and lows, the levels where price turned before and the candles that form at those levels. It uses few or no indicators, but it still needs written rules, a stop loss and testing, because reading a chart is partly subjective.
 Chương 1Market structure: swing highs and swing lows.A swing high is a peak with lower highs on both sides, and a swing low is a trough with higher lows on both sides. An uptrend makes higher highs and higher lows; a downtrend makes lower highs and lower lows. A break of structure is price moving beyond the last swing point that defined that trend.
 Chương 1Key levels for price action traders.Key levels are the few prices where the market has clearly turned before, such as higher-timeframe swing highs and lows, the previous day's and week's high and low, and round numbers. Marking about two above price and two below, as zones, shows you where to pay attention and where a trade has room to move.

