Market structure: swing highs and swing lows.
A swing high is a peak with lower highs on both sides, and a swing low is a trough with higher lows on both sides. An uptrend makes higher highs and higher lows; a downtrend makes lower highs and lower lows. A break of structure is price moving beyond the last swing point that defined that trend.
Nội dung này hiện chỉ có bản tiếng Anh.

Price rarely moves in a straight line. It rises in steps with pullbacks between them, and each turn leaves a peak or a trough on the chart. Those turning points are swings, and the order they appear in is called market structure.
The previous lesson described reading the bare chart. Marking swings is often the first step, because it shows whether a pair is trending and at what price that reading would be proven wrong.
What is a swing high and a swing low?
Picture five candles in a row where the middle one reaches the highest price. Its high is above the highs of the two candles before it and the two after it. That middle high is a swing high.
A swing low is the mirror image: a candle whose low sits below the lows of the two candles on each side.
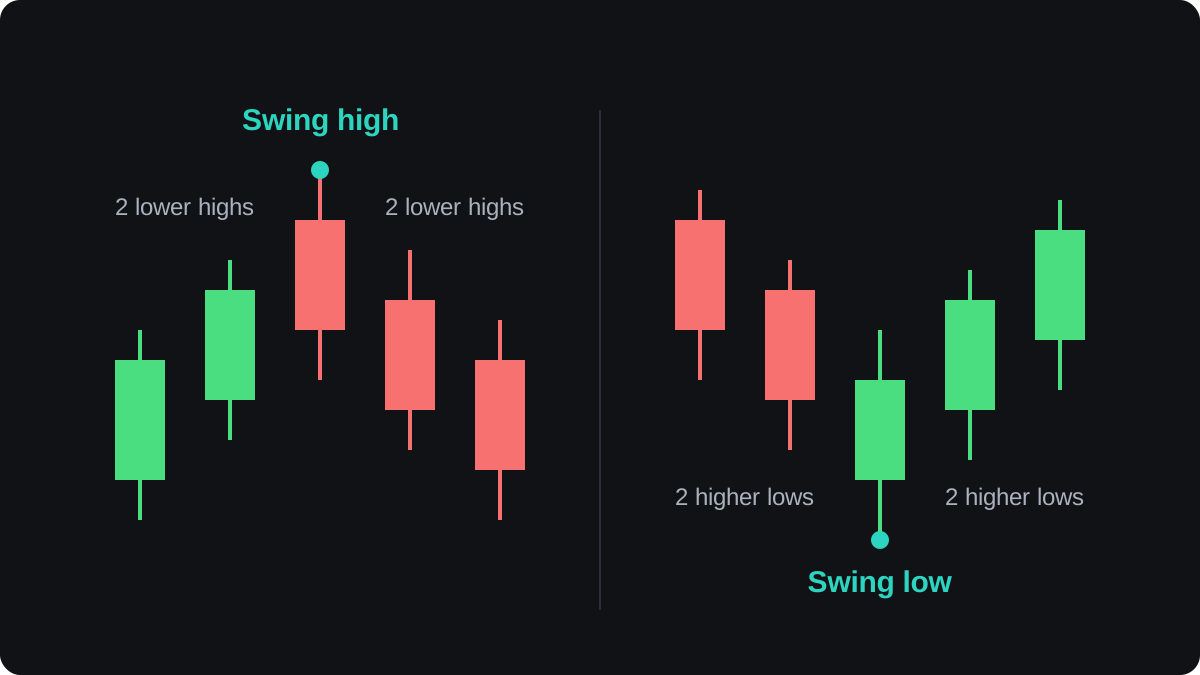
Two candles on each side is a common rule, and MetaTrader's built-in Fractals indicator is based on the same five-candle shape. Some traders use three or more candles per side, which gives fewer and larger swings.
Every swing is confirmed late, because you need the candles that come after it. On a 4-hour chart, a swing high is confirmed at the earliest when the second candle after it closes, eight hours after the swing candle's own close.
When two highs sit at exactly the same price, rules differ: some traders count the first, some count the second. Choose one rule and apply it the same way every time.
How do swings show an uptrend or a downtrend?
An uptrend is a run of higher highs and higher lows. Each peak goes above the last peak, and each pullback stops above the last pullback.
A downtrend is the reverse, a run of lower highs and lower lows. Each rally fails below the previous rally, and each drop reaches a new low.
Here is an illustrative uptrend on a 4-hour EUR/USD chart, with round prices. On this pair a pip is 0.0001.
- Price makes a swing low at 1.08000.
- It rises to a swing high at 1.08600, a move of 60 pips.
- It pulls back 35 pips to 1.08250. That is above 1.08000, so it is a higher low.
- It rallies 65 pips to 1.08900. That is above 1.08600, so it is a higher high.
- It pulls back 40 pips to 1.08500, another higher low, above 1.08250.
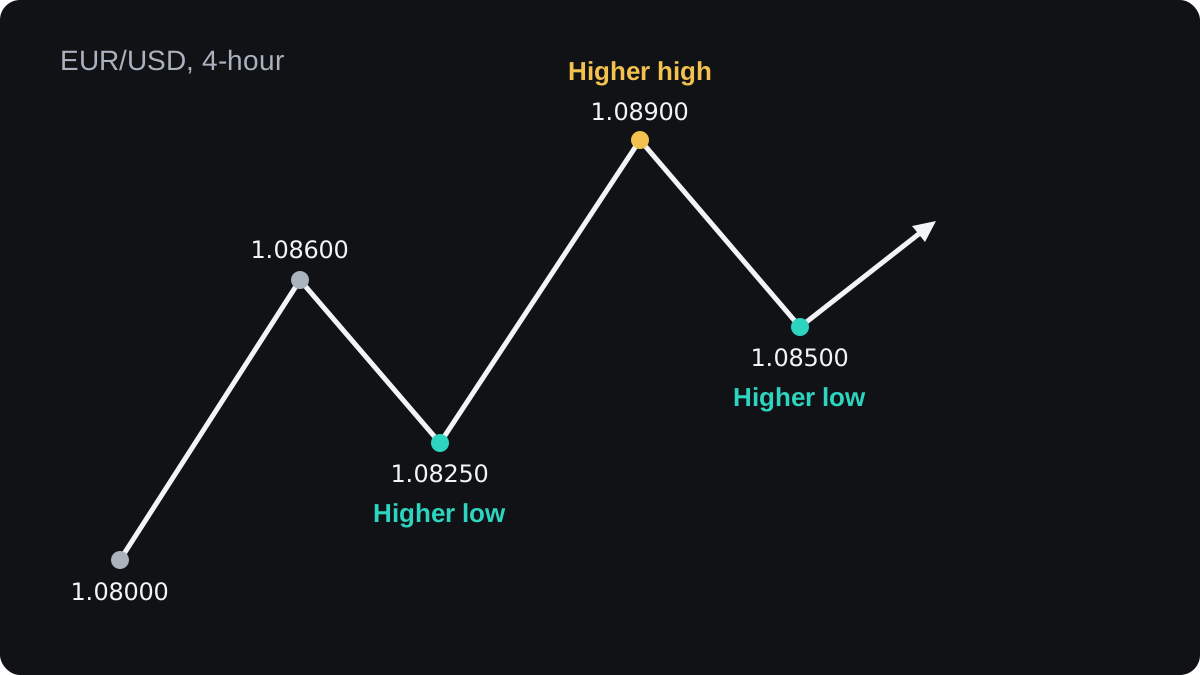
The steps do not need to be even. The second pullback here was deeper than the first, 40 pips against 35, and the trend still holds because each low stayed above the one before.
While price stays above 1.08500, the latest higher low, the uptrend reading stands. That makes the last higher low the level to watch in an uptrend, and the last lower high the level to watch in a downtrend.
What is a break of structure?
The uptrend example continues. After the higher low at 1.08500, EUR/USD rallies to 1.08800 and turns down. That peak is below 1.08900, so it is the first lower high of the move.
Price then falls through 1.08500, and a 4-hour candle closes at 1.08420, 8 pips below the last higher low. The run of higher lows has ended.
A move beyond a swing point that defined the trend, like this one, is a break of structure.
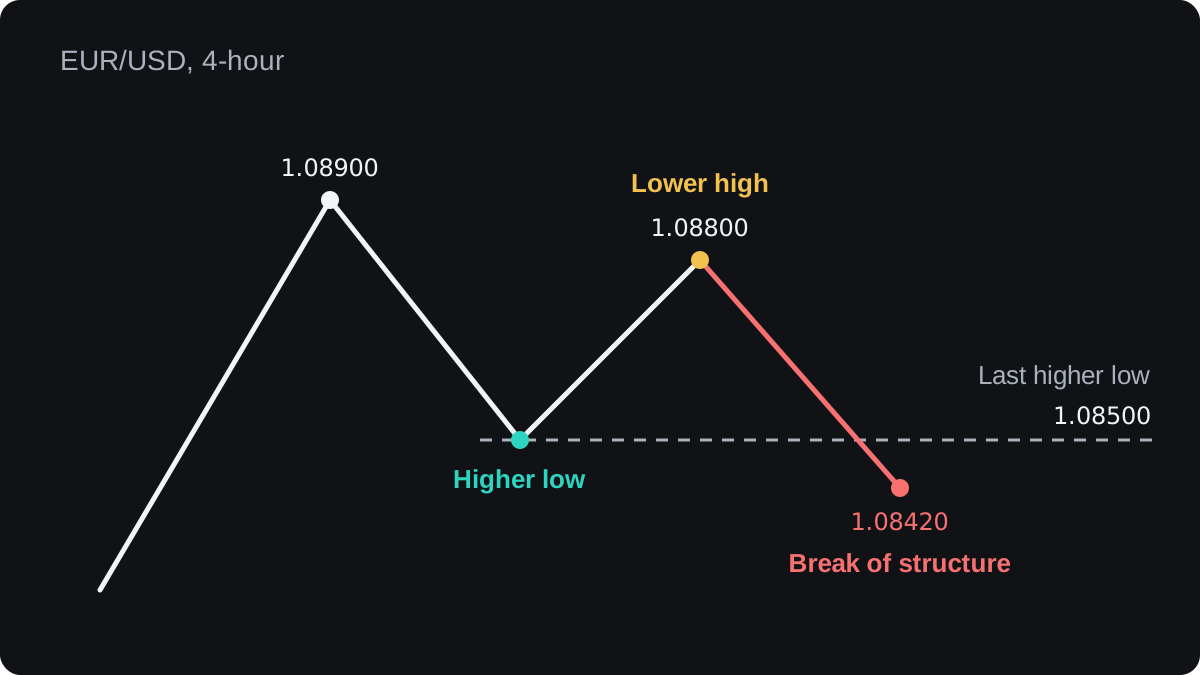
A break can also go with the trend, such as a close above 1.08900 during the uptrend.
Names vary for the two cases. Some traders keep break of structure for the move with the trend and call the first break against it a change of character. Others use one name for both.
A break against the trend says the old pattern has stopped. A new downtrend needs more evidence: fresh lower highs and lower lows after the break.
Using the last swing to place a stop
A swing point also marks where a trade idea is wrong. The trade below illustrates the arithmetic and is an example, not a recommendation.
- A trader buys 0.10 lot of EUR/USD at 1.08700, after the higher low at 1.08500 has formed.
- They place a stop loss 5 pips under that low, at 1.08450.
- The distance is 1.08700 minus 1.08450 = 0.00250, which is 25 pips.
- On 0.10 lot, 10,000 euros, a pip is worth 10,000 × 0.0001 = $1, so the planned loss is 25 × $1 = $25.
- Price reaches 1.08800, then falls to 1.08420. The stop at 1.08450 is hit on the way down, for a loss of about $25 plus any slippage and trading costs.
What does a range look like in swing terms?
Sometimes the swings stop stepping in one direction. Highs stall near one price and lows stall near another, so the pair drifts sideways between them.
Take a separate illustrative chart. EUR/USD tops at 1.08900 and then 1.08880, and bottoms at 1.08500 and then 1.08520. Strictly, that is a lower high and a higher low.
Steps of 2 pips on a 4-hour chart say little, though. The chart reads as a 40 pip range between 1.08500 and 1.08900.
Mixed swings, such as a higher high followed by a lower low, also mean there is no clean trend. Methods built for trends often struggle there, as the lesson on trending versus ranging markets explains.
Where reading structure goes wrong
Structure depends on the timeframe. The 4-hour uptrend above could hold a 15-minute downtrend inside each pullback, so always say which chart you mean. The lessons on multiple timeframes take this further.
Wicks can fool the eye. Price may trade below 1.08500 for a few minutes and close back above it. Requiring a close beyond the level filters out some of those spikes.
Even a close can mislead, and the lesson on false breakouts shows how a clean-looking break can still reverse.
Two people can mark different swings on the same chart. A two-candle rule and a three-candle rule can pick different lows, which moves the last higher low and every decision tied to it.
Structure describes what price has already done. Rigorous public evidence that swing breaks alone predict the next move is thin, so test any rule on a demo account before you trust it with money.
The swings you mark here are also the first candidates for support and resistance, which the next lesson on price levels builds on.
Câu hỏi thường gặp
What is a higher high and a higher low?
A higher high is a swing high above the previous swing high. A higher low is a swing low above the previous swing low, and a run of both is an uptrend.
How many candles make a swing high?
There is no fixed number. A common rule needs two lower highs on each side, five candles in all, and using more candles per side marks fewer, larger swings.
Does a break of structure mean the trend has reversed?
Not by itself. It means the pattern that defined the trend has stopped, and a new trend needs fresh swings in the other direction. Sometimes the old trend simply resumes.
Should I use the wick or the close to judge a break?
Both are in use. A close beyond the level ignores brief spikes but confirms later, while a wick rule reacts sooner and triggers on more false moves. Pick one and apply it consistently.
Which timeframe should I use for market structure?
Use the chart you make decisions on, and say which one it is. A daily chart and a 15-minute chart can show trends in opposite directions at the same moment.
Học tiếp
 Chương 1What is price action trading?Price action trading means deciding when to buy or sell from the price chart itself: the swing highs and lows, the levels where price turned before and the candles that form at those levels. It uses few or no indicators, but it still needs written rules, a stop loss and testing, because reading a chart is partly subjective.
 Chương 1Key levels for price action traders.Key levels are the few prices where the market has clearly turned before, such as higher-timeframe swing highs and lows, the previous day's and week's high and low, and round numbers. Marking about two above price and two below, as zones, shows you where to pay attention and where a trade has room to move.
 Chương 1Candle signals at key levels.A candle signal is a candle whose shape tells you how buyers and sellers behaved at a price. Pin bars, inside bars and engulfing candles carry more weight at a support or resistance level you marked in advance, in the direction of the wider structure. Away from a level they mean little, and even at one they can fail.

