What is price action trading?
Price action trading means deciding when to buy or sell from the price chart itself: the swing highs and lows, the levels where price turned before and the candles that form at those levels. It uses few or no indicators, but it still needs written rules, a stop loss and testing, because reading a chart is partly subjective.

You open a EUR/USD chart and delete every indicator. What is left is candles. You can still see where price turned and whether each dip stopped higher than the last one.
Trading from that view is price action trading: making buy and sell decisions from price itself, its swings, the levels where it reacted before and the candles that form there. Indicators play a small part or none.
Why would anyone trade without indicators?
Every indicator is a formula run on past prices. A 20-period simple moving average is the average of the last 20 closes, so it can only turn some time after price has turned.
Price action traders skip that step. They read the raw prices the formulas are built from, on the view that a broken high or a rejected level shows the same information earlier.
The idea is reasonable, and it has a cost. Earlier information is noisier, and a bare chart gives you no number to lean on when you are unsure.
What does a price action trader read?
A price action trader reads the chart in layers, usually starting with the trend and finishing with the latest candle.
Structure: the swings
A swing high is a candle whose high sits above the highs of the candles on both sides of it, and a swing low is the reverse.
A market making higher highs and higher lows is in an uptrend. Lower highs and lower lows mark a downtrend.
The next lesson, on swing highs and swing lows, shows how to mark them the same way every time.
Levels: where price reacted before
Old highs, old lows and round numbers are prices where the market turned before. When price breaks above an old high, you can watch that price as possible support if the market comes back down to it.
Treat a level as a zone a few pips wide, because price rarely turns at the exact same digit twice. The support and resistance lesson covers this in more detail.
Candles: what happens at the level
A single candlestick shows the open, high, low and close of one period. At a support zone, a candle with a long lower wick and a close near its high shows that sellers pushed price down and buyers pushed it back.
The candle takes its meaning from where it forms. The same shape far from any level carries much less information.
A worked example: buying a pullback in an uptrend
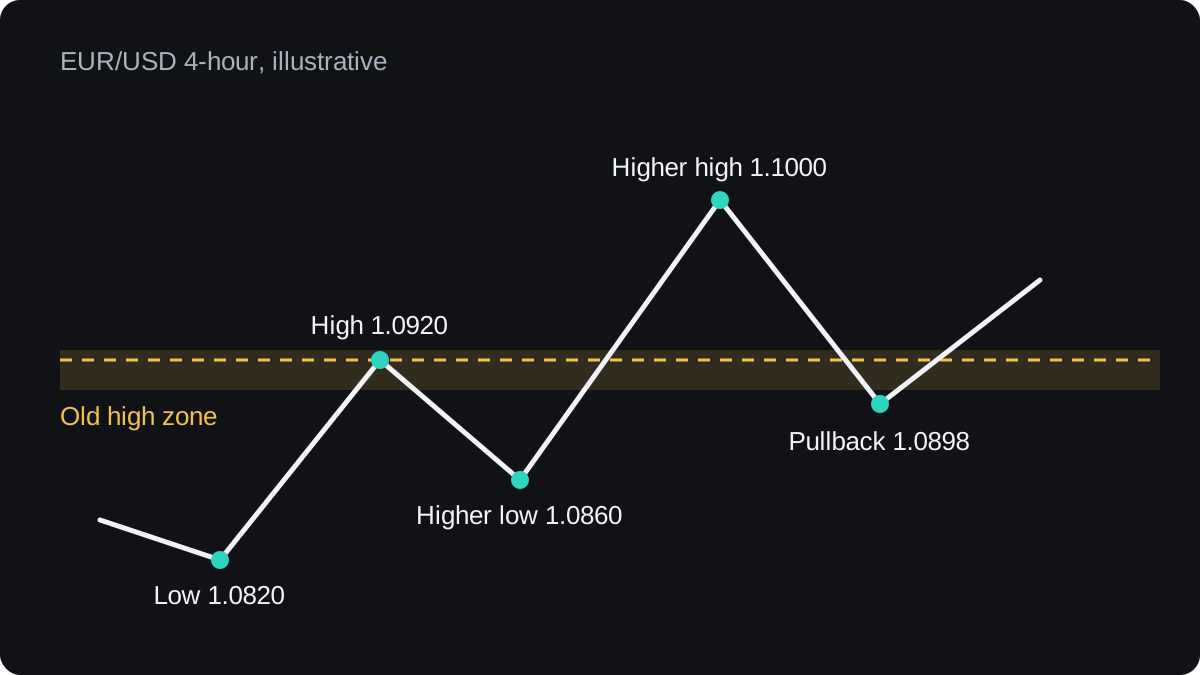
The prices below are round illustrative numbers on a EUR/USD 4-hour chart, the same path as the diagram above. They ignore the spread to keep the sums clear.
- Structure. Price made a low at 1.0820, a high at 1.0920, a higher low at 1.0860 and a higher high at 1.1000. That is an uptrend.
- Level. The old high at 1.0920 is now a possible support zone, roughly 1.0905 to 1.0925.
- Candle. Price falls back into the zone. One candle opens at 1.0914, dips briefly to 1.0898, then closes at 1.0930, near its high of 1.0934.
- Entry. You buy at 1.0930.
- Stop. The stop goes below the candle's low with a small buffer, at 1.0890. That is 1.0930 minus 1.0890 = 0.0040, or 40 pips.
- Target. The last swing high at 1.1000 may act as resistance, so the target sits just under it at 1.0990. That is 1.0990 minus 1.0930 = 0.0060, or 60 pips.
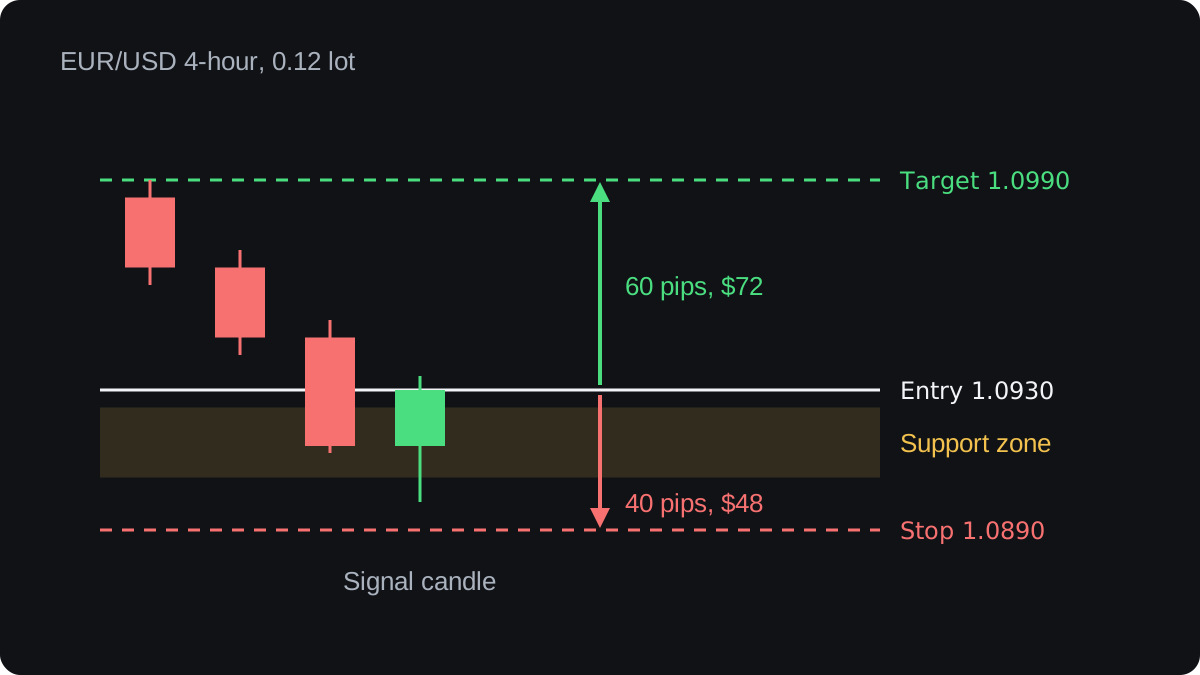
The chart sets the stop distance. Your trade size then sets how much money that distance is worth, so you work it out from your risk, as the position size lesson explains.
Say the account holds $5,000 and you risk 1%, which is $50:
- On EUR/USD one pip on one standard lot is $10, so 0.01 lot is $0.10 per pip.
- $50 ÷ 40 pips = $1.25 per pip, which would be 0.125 lot.
- Platforms usually size in steps of 0.01 lot, so round down to 0.12 lot, or $1.20 per pip.
- Loss at the stop: 40 × $1.20 = $48.
- Gain at the target: 60 × $1.20 = $72.
The possible gain is 1.5 times the possible loss. That ratio tells you how often the trade must work to break even.
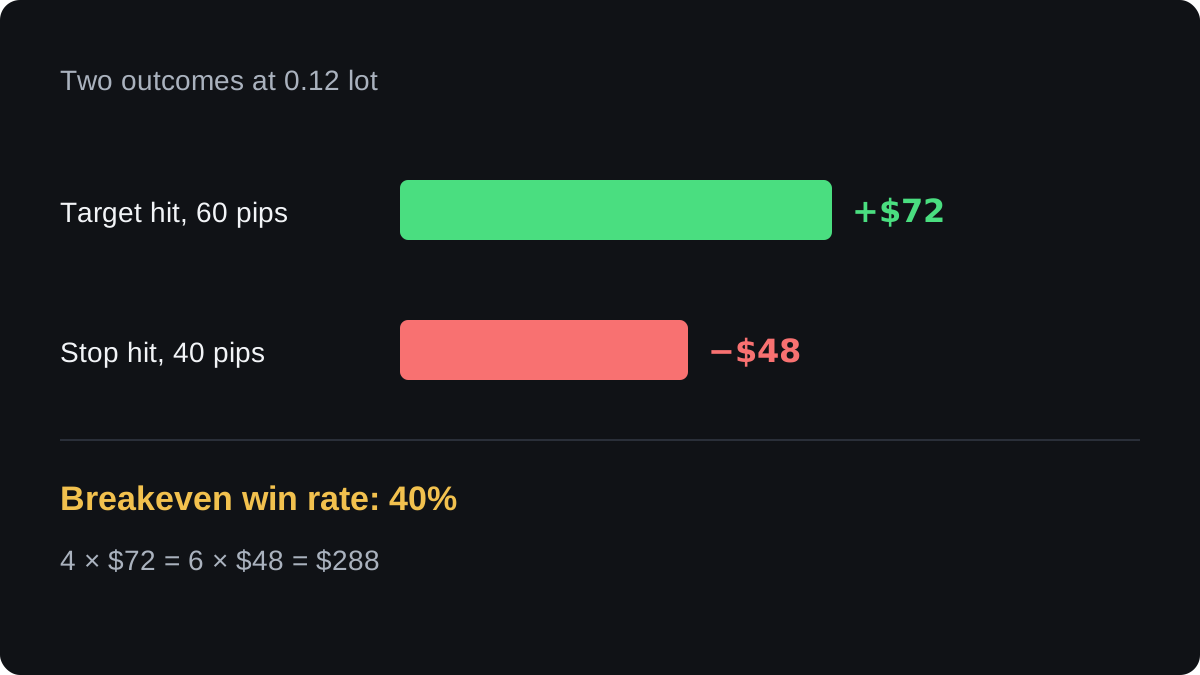
Out of 10 such trades, 4 winners make 4 × $72 = $288 and 6 losers cost 6 × $48 = $288.
So the setup must reach its target more than 40% of the time just to cover itself before costs. The risk-reward lesson explains the formula.
Nothing on the chart tells you whether a setup like this wins more than 40% of the time. Only a record of many such trades can.
Where does price action trading go wrong?
The method looks clean on a finished chart. At the right edge, where you actually trade, it is messier.
- Two traders can mark different swings on the same chart, or read the same swings on different timeframes, and reach opposite views.
- Patterns are easy to see in hindsight. Textbook examples, including the one above, are chosen after the result is known.
- Price often pokes through a level and then reverses, so a stop placed just beyond an obvious zone can be hit before the move you expected.
- A news release can jump price past your stop, and the fill can be worse than the stop price. That gap is slippage.
- The evidence is thin. Published tests of candlestick patterns have given mixed results, and an edge seen in past data can disappear once spreads and commission are counted.
Indicator methods face the same hindsight and cost problems. What matters more is which approach you can apply the same way every time.
What does price action trading ask of you?
Because the chart leaves so much to judgement, the work moves into rules you write before you trade. If you cannot write a rule down, you cannot test it.
Your rules should answer questions such as these:
- What counts as a swing high? For example, a candle whose high is above the highs of the two candles on each side.
- How wide is a zone, and how close must price come to count as a touch?
- Which candle shape, closing where, gives an entry?
- Where do the stop and the target go?
- Which timeframe do you use, and do you skip trades around major news?
Then test them. Mark every past setup that meets your rules, losers included, and record each result. The backtesting lesson shows how, and a demo account is the next step before any real money.
Expect fewer trades than an indicator alert would give you. Most of the time no setup meets every rule, and waiting for one is part of the method.
Questions
Is price action trading better than using indicators?
Neither is better in general. Indicators are calculated from price, so they add no new information, but they make rules easier to state and test. Price action reads the source directly and needs more judgement.
Do price action traders use any indicators?
Some use none. Others keep one or two, such as a moving average for trend direction, and treat them as background to the swings and levels.
Which timeframe is best for price action?
No timeframe suits everyone. Higher timeframes such as the 4-hour or daily chart give fewer and slower setups, while lower ones give more setups and the spread is a larger share of each move. Test your rules on the timeframe you will trade.
Is price action trading profitable?
No method guarantees a profit, and price action is no exception. Whether your version works can only be judged from a large set of tested and recorded trades, after costs.
Can a beginner learn price action?
Yes, and the bare chart is a sensible place to start because every other tool is built on it. Begin by marking swings and levels on past charts before you place any trades.
Keep learning
 Chapter 1Market structure: swing highs and swing lows.A swing high is a peak with lower highs on both sides, and a swing low is a trough with higher lows on both sides. An uptrend makes higher highs and higher lows; a downtrend makes lower highs and lower lows. A break of structure is price moving beyond the last swing point that defined that trend.
 Chapter 1Key levels for price action traders.Key levels are the few prices where the market has clearly turned before, such as higher-timeframe swing highs and lows, the previous day's and week's high and low, and round numbers. Marking about two above price and two below, as zones, shows you where to pay attention and where a trade has room to move.
 Chapter 1Candle signals at key levels.A candle signal is a candle whose shape tells you how buyers and sellers behaved at a price. Pin bars, inside bars and engulfing candles carry more weight at a support or resistance level you marked in advance, in the direction of the wider structure. Away from a level they mean little, and even at one they can fail.

