Price channels and how to trade them.
A price channel is two parallel lines that contain a trend: a trend line along the swing lows or highs and a copy on the other side. Near the lower edge a buy aims for the upper edge, and the reverse at the top. A close outside either line can mean the channel has ended.
Nội dung này hiện chỉ có bản tiếng Anh.

Picture EUR/USD climbing for a week. Each dip stops a little higher than the last, and each rally stalls a little higher too. Draw one line under the dips and a parallel line over the rallies, and you have a price channel.
The lower line is rising support and the upper line is rising resistance. The gap between them stays roughly the same, which gives you a frame for deciding where to enter and where to exit.
What does a price channel look like?
A price channel is two parallel lines that contain price for a while. One is a trend line through the swing lows or swing highs. The other is a copy of it, moved to the opposite side of price.
In this illustrative daily chart, EUR/USD makes a low at 1.08000 on day 1 and another at 1.08400 on day 3. The lower line through them rises 20 pips a day.
On day 2, between those lows, price reaches a high of 1.08800. The lower line sits at 1.08200 that day, so the high is 60 pips above it.
A parallel line through that high is the upper edge. On day 4 price reaches 1.09200, again 60 pips above the lower line, which is then at 1.08600. On day 5 it dips to 1.08800, back on the lower line.
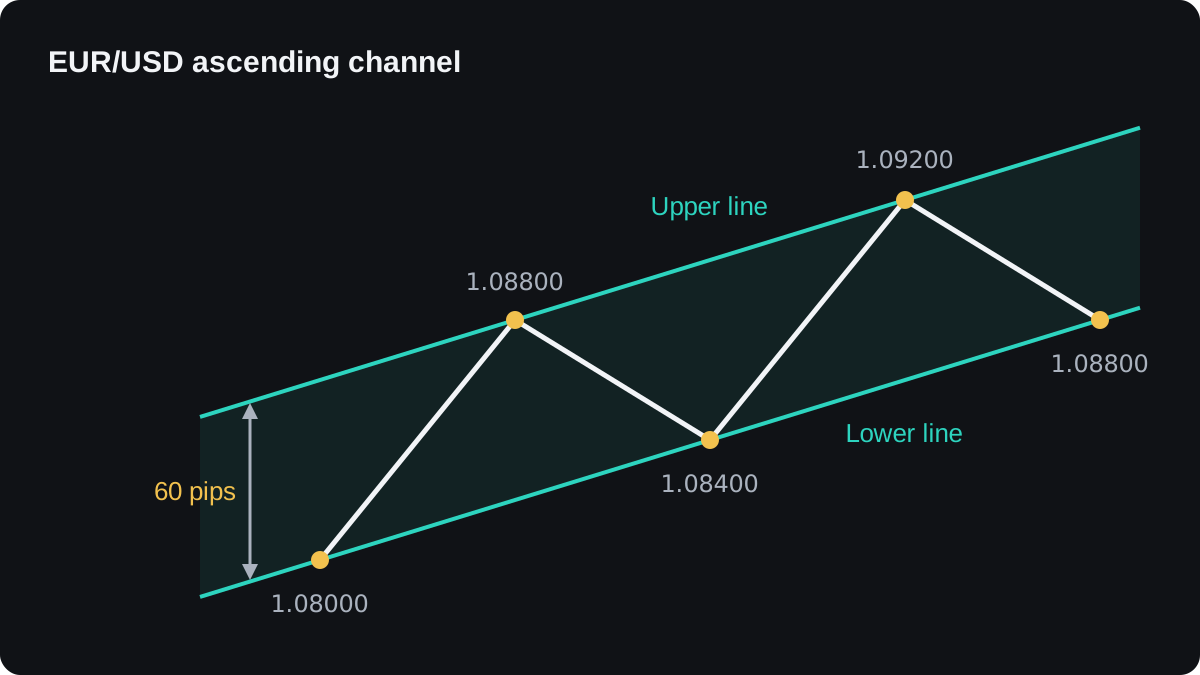
The distance between the lines, measured straight up and down, is the channel width. Here it is 60 pips. A narrow channel can leave too little room for a trade once the spread is paid.
What types of channels are there?
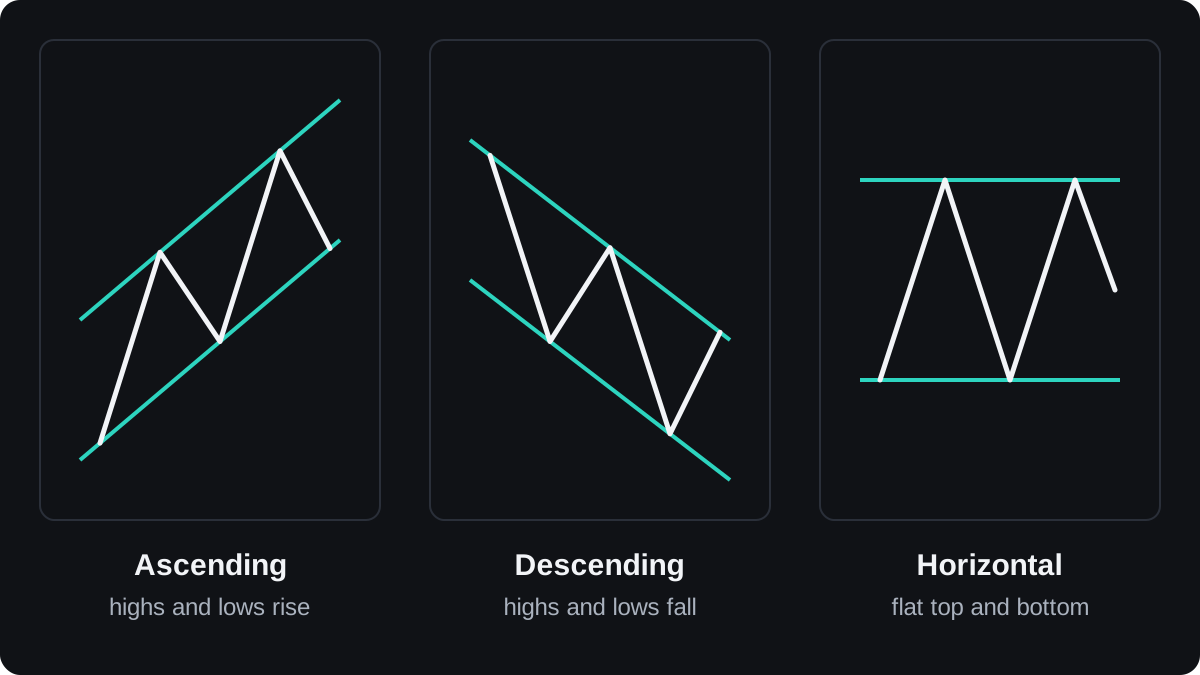
A channel takes its name from its slope. An ascending channel rises, with higher lows and higher highs, and frames an uptrend. A descending channel falls, with lower highs and lower lows, and frames a downtrend.
A horizontal channel has a flat top and bottom. It is a range, where support and resistance stay at fixed prices.
Some platforms also offer indicator channels, such as a Donchian channel, which plots the highest high and lowest low of a set number of bars. Those are calculated for you. This lesson covers channels you draw yourself.
How do you draw a channel?
The steps follow the example above:
- Decide the direction first. In an uptrend start with the lows, and in a downtrend start with the highs.
- Draw the main line through at least two swing points, here the 1.08000 and 1.08400 lows.
- Copy that line and move it, keeping the same angle, to the furthest swing point on the other side, here the 1.08800 high.
- Wait for price to touch the second line again before you rely on it. In the example, the 1.09200 high is that touch.
MetaTrader has an Equidistant Channel drawing tool that does steps 2 and 3 together. You set the first line with two points, then drag the parallel copy to the third.
Price rarely touches both lines exactly. Some wicks poke through and some turns stop short, which is why the zones lesson treats each edge as an area a few pips wide.
If you must tilt the lines every few bars to keep price inside, you are forcing a channel onto the chart. A channel worth using holds its angle for several swings.
What trades does a channel suggest?
Each edge suggests a trade. Near the lower line, a buy aims for the upper line. Near the upper line, a sell aims for the lower line. The stop goes just outside the edge you traded from.
In a sloping channel the two trades differ. A buy at the bottom of an ascending channel goes with the slope. A sell at its top goes against it, and the trend can carry price through your stop before any pullback comes.
A simple filter is to trade only the edge that matches the slope: buys in a rising channel, sells in a falling one. In a horizontal channel the two edges are equal.
A touch of the line alone is a weak reason to enter. Waiting for price to turn at the edge, such as a candle that dips into the zone and closes back away from it, filters out some of the touches that break.
A worked channel trade with numbers
Return to the example on day 5. The lower line has reached 1.08800, and the upper line is 60 pips higher, at 1.09400. All numbers are illustrative.
- Entry: price dips to the lower line and turns up. You buy EUR/USD at 1.08850, 5 pips above the line.
- Stop: 1.08650, 15 pips below the line. The risk is 1.08850 minus 1.08650 = 0.00200, which is 20 pips.
- Target: 1.09350, 5 pips below the upper line. The reward is 1.09350 minus 1.08850 = 0.00500, which is 50 pips.
- Reward to risk: 50 ÷ 20 = 2.5.
- Size: with a $5,000 account and an illustrative risk of 1%, you accept a loss of $50. $50 ÷ 20 pips = $2.50 per pip.
- One standard lot of EUR/USD is worth $10 a pip, so $2.50 a pip is 0.25 lot.
- Result: at the target you gain 50 × $2.50 = $125. At the stop you lose 20 × $2.50 = $50.
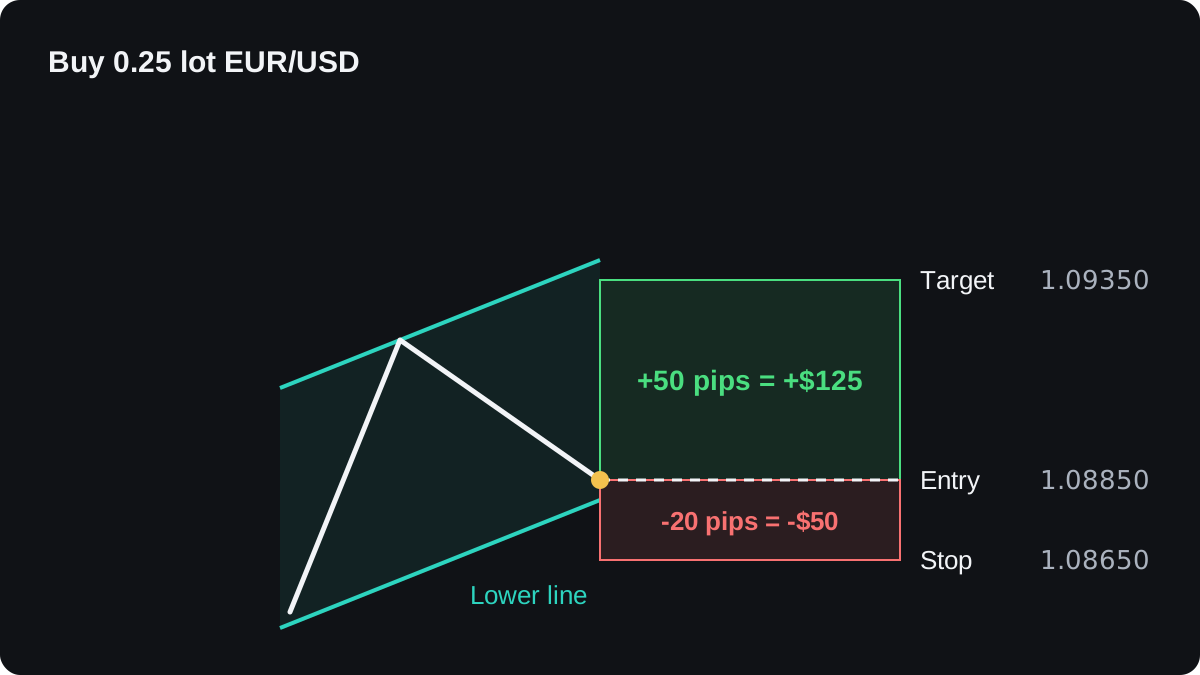
The target uses the upper line's value on day 5. That line rises 20 pips a day, so if price takes two more days to get there, the edge will sit at 1.09400 + 40 pips = 1.09800.
You can raise the target with the line or leave it fixed.
These sums ignore the spread and any commission, which make a real result slightly worse. The position size lesson repeats the sizing step for other pairs.
A 2.5 to 1 ratio says nothing on its own about whether the trade is worth taking. The risk-reward ratio lesson explains how it combines with your win rate.
When does a channel break, and what then?
Sooner or later price leaves every channel. A candle that closes clearly outside a line is the usual sign that the old edges no longer hold.
A break against the slope, such as a close below the lower line of an ascending channel, can mean the uptrend is ending. A break with the slope, above the upper line, can mean the trend is speeding up.
One rough target after a break is the channel width projected from the breakout point, so a 60 pip channel suggests a 60 pip move. Treat that as a guess, since breaks can run much further or reverse quickly.
Many breaks fail and price slips back inside. The false breakouts lesson covers those, and trading the bounce or the break compares the two approaches side by side.
How reliable are price channels?
A channel is a drawing, and two people can draw different ones on the same chart. The swing points you pick, the timeframe and whether you use wicks or closes all move the lines.
Channels also look better in hindsight. On an old chart you choose lines that fit, so every touch looks neat. On a live chart you cannot know which touch will be the last one before a break.
There is little rigorous evidence that hand-drawn channels predict price on their own. Treat one as a map of where the trend has been, and backtest any channel rule on past data before you risk money on it.
Câu hỏi thường gặp
What is the difference between a trend line and a channel?
A trend line is one line along the lows or the highs. A channel adds a parallel line on the other side of price, so it marks both edges of the trend.
How many touches does a price channel need?
Two swing points draw the first line and a third places the parallel line. A further touch on the second line, like the 1.09200 high in this lesson, gives you a channel worth testing, though no number of touches guarantees the next one.
Can you sell at the top of an ascending channel?
You can, but that trade goes against the slope and aims only for a pullback. The trend can push straight through, so the stop needs to sit just above the upper line to keep the loss small.
What timeframe is best for price channels?
Channels form on every timeframe. Those on daily or 4-hour charts are built from larger swings, while channels on short timeframes are smaller and usually last a shorter time.
Is a price channel the same as a Donchian channel?
No. A Donchian channel is an indicator built from the highest high and lowest low over a set number of bars, so its lines move in steps and are rarely parallel. A drawn price channel follows the slope of the trend.
Học tiếp
 Chương 1What are support and resistance levels?Support is a price area where falling prices have stopped and turned up more than once, because buyers stepped in there. Resistance is the opposite: an area where rises have stalled because sellers took over. Traders use both to plan entries, stops and targets, but any level can break, so none is a guarantee.
 Chương 1How to draw support and resistance.To draw support and resistance, find swing highs and lows where price turned at about the same price two or more times, then draw a horizontal line through that cluster. Start on the daily or weekly chart for the main levels, refine them on a 4-hour or 1-hour chart, and keep only the nearest few.
 Chương 1Why support and resistance are zones, not lines.Price rarely turns at one exact number, because orders spread out around a level and price feeds differ slightly between brokers. Treat support and resistance as a zone: a band from the bodies to the wicks of past reactions. Put your stop beyond the far edge, then size the trade so the risk stays fixed.
 Chương 1When support becomes resistance.When price breaks through a support level, that level often acts as resistance when price returns to it, and broken resistance often turns into support. The return visit is called a retest. Traders watch for a candle that reaches into the old zone and closes back on the break side, though the flip can fail.
 Chương 1How to draw a trend line.To draw an uptrend line, connect two or more rising swing lows and extend the line to the right. For a downtrend, connect falling swing highs. Two points draw the line, a third reaction is the usual sign it is confirmed, and a candle closing clearly beyond it usually means the line has stopped counting.
 Chương 1Trading the bounce or the break.Trading the bounce means buying near support or selling near resistance while the level holds, with a stop just beyond it. Trading the break means entering after price closes through the level, with a stop back inside the old range. Bounce trades fail when the level breaks; break trades fail on false breakouts.
 Chương 1Support and resistance cheat sheet.Support is a price area where falls have stopped before, and resistance is one where rises have stopped. Mark them as zones from clear swing highs and lows, expect broken levels to swap roles, and plan every bounce or break with a stop beyond the zone. Levels show where to watch, and any of them can break.

