What is a trading system?
A trading system is a written set of rules that decides which market you trade, when you enter, when you exit and how much you risk on each trade. Following the same rules every time makes your decisions consistent and lets you measure results, though no system wins every trade or guarantees a profit.
Nội dung này hiện chỉ có bản tiếng Anh.

Picture two people looking at the same EUR/USD chart. One buys because the price looks ready to rise. The other buys because a written rule says so, and already knows where the trade will close and how much it can lose.
The second person is using a trading system. Given the same chart and the same rules, they would make the same decision on a calm day or a stressful one.
What is a trading system made of?
A trading system is a written set of rules that decides which market you trade, when you enter, when you exit and how large each position is. The more exact the rules, the more closely two people following them will place the same trades.
Most systems answer the same short list of questions:
- Market and timeframe: which pair you trade and which chart you read, such as EUR/USD on the 4-hour chart.
- Entry rule: the exact event that opens a trade.
- Exit rules: a stop loss for when you are wrong, and a target or other rule for when you are right.
- Position size: how many lots you trade, usually set so each loss costs a fixed share of your account.
- No-trade rules: times or conditions when you stay out, such as just before a major economic release.
A rule only counts if you can check it. Buy when the trend looks strong fails that test, because two people will disagree about what strong means.
Buy when a candle closes above the 50-period moving average passes, because anyone can look at the chart and see whether it happened.
An example system, written out
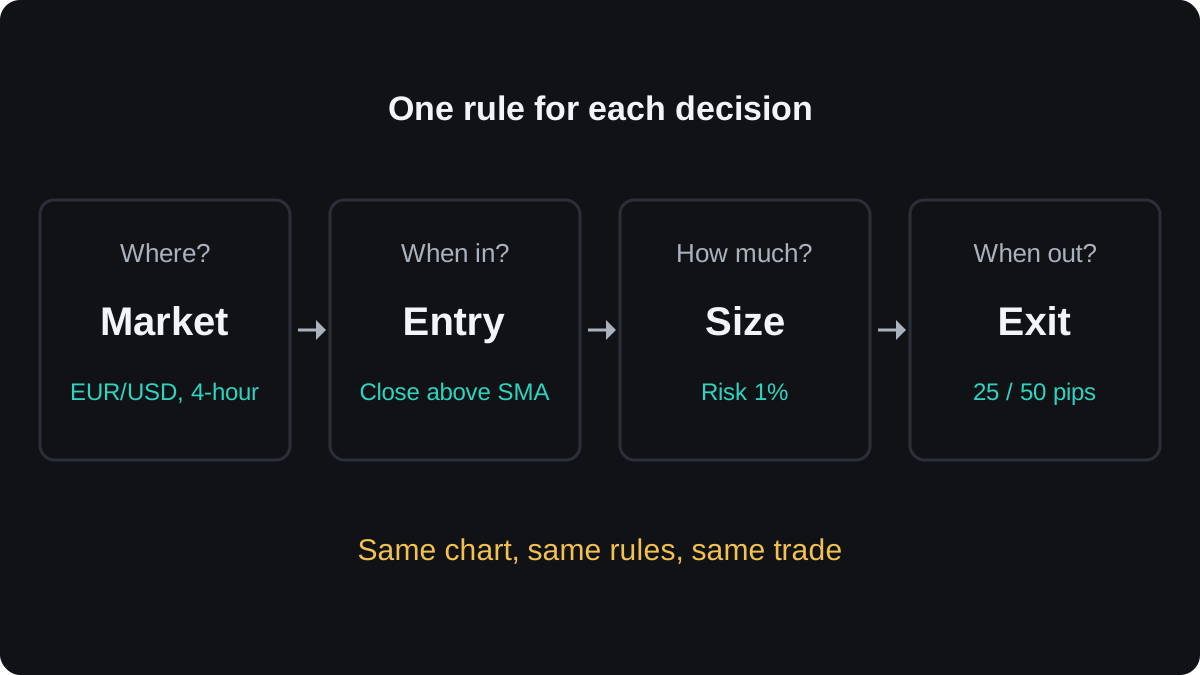
Here is a simple system written in full. It shows what complete rules look like, and nothing here suggests that this particular system makes money.
- Market: EUR/USD on the 4-hour chart.
- Entry: buy when a candle closes above the 50-period simple moving average, after the previous candle closed below it. Sell on the mirror image.
- Stop loss: 25 pips from the entry price.
- Take profit: 50 pips from the entry price.
- Size: risk 1% of the account balance on each trade.
- No trade: no new entries in the 30 minutes before a high-impact release, and only one trade open at a time.
Each rule settles a decision you would otherwise make on the spot: where to trade, when to get in, how much to trade and when to get out.
One trade, worked through with the rules
Say your balance is $5,000 and a 4-hour candle closes above the moving average at 1.10400. The system says buy. Every number below comes from the rules, so you choose none of them.
- Risk: 1% of $5,000 is $50.
- Stop: 25 pips below 1.10400 is 1.10150.
- Target: 50 pips above 1.10400 is 1.10900.
- Pip value needed: $50 ÷ 25 pips = $2 per pip.
- Size: one standard lot of EUR/USD is worth $10 per pip, so $2 per pip means 0.20 lot.
- Outcome: if the stop is hit, you lose 25 × $2 = $50. If the target is hit, you gain 50 × $2 = $100.
The chart below marks those three prices and the money at each one.
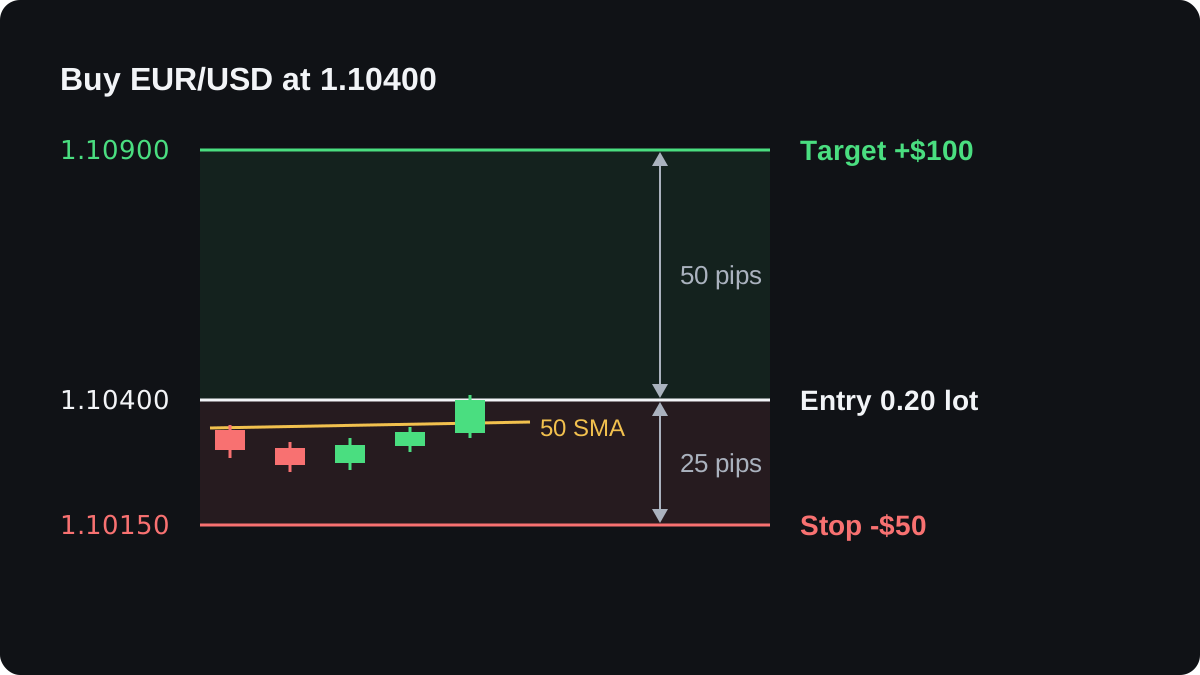
These figures cover price movement only, before the spread and any commission. The position size lesson repeats the same steps for other pairs, and the lot size calculator does the arithmetic for you.
Why written rules help
Without rules, each trade is a fresh decision made under pressure. After two losses you might halve the next position, or double it to win the money back, and neither choice was planned.
A written system makes those choices before the trade starts. You will still feel fear and hope, but they have fewer decisions left to influence.
Rules also make your trading measurable. If you trade on feel, a bad month tells you little, because you cannot say which decision caused it.
If you follow a system, you can count wins and losses, add up what each trade cost and judge the rules themselves.
You cannot test a feeling against past charts. A rule like the one above can be checked against years of data.
Mechanical and discretionary systems
A mechanical system has rules so exact that a computer could follow them. The example above is mechanical: a candle either closes above the average or it does not. A system like this can be coded as an expert advisor that trades automatically.
A discretionary system leaves some calls to you. It might say buy at support when a bullish candle pattern appears, which still needs your eye to decide what counts as support.
Mechanical systems are easier to test and leave no room for argument. Their weakness is that they cannot react to anything outside their rules, such as a surprise central bank statement.
Discretionary systems can adapt to events like that. The cost is that they are harder to measure, because your judgement shifts from day to day.
A system can mix both, with fixed rules for size and stops and some judgement on entries. If you do that, write down what your judgement is looking for, so you can review it later.
What a system can and cannot do
No system wins every trade. A system is judged over many trades by its expectancy, the average amount it makes or loses per trade.
The formula is: expectancy = (win rate × average win) minus (loss rate × average loss).
Take the example system with invented results over 100 trades, keeping the risk at $50 a trade for simplicity: it wins 40 times at $100 and loses 60 times at $50.
Assume a spread of 1 pip, which on 0.20 lot of EUR/USD costs $2 a trade.
- Wins: 40 × $100 = $4,000.
- Losses: 60 × $50 = $3,000.
- Before costs: $4,000 minus $3,000 = $1,000, which is $10 per trade. The formula agrees: (0.40 × $100) minus (0.60 × $50) = $40 minus $30 = $10.
- Costs: 100 trades × $2 = $200.
- After costs: $1,000 minus $200 = $800, which is $8 per trade.
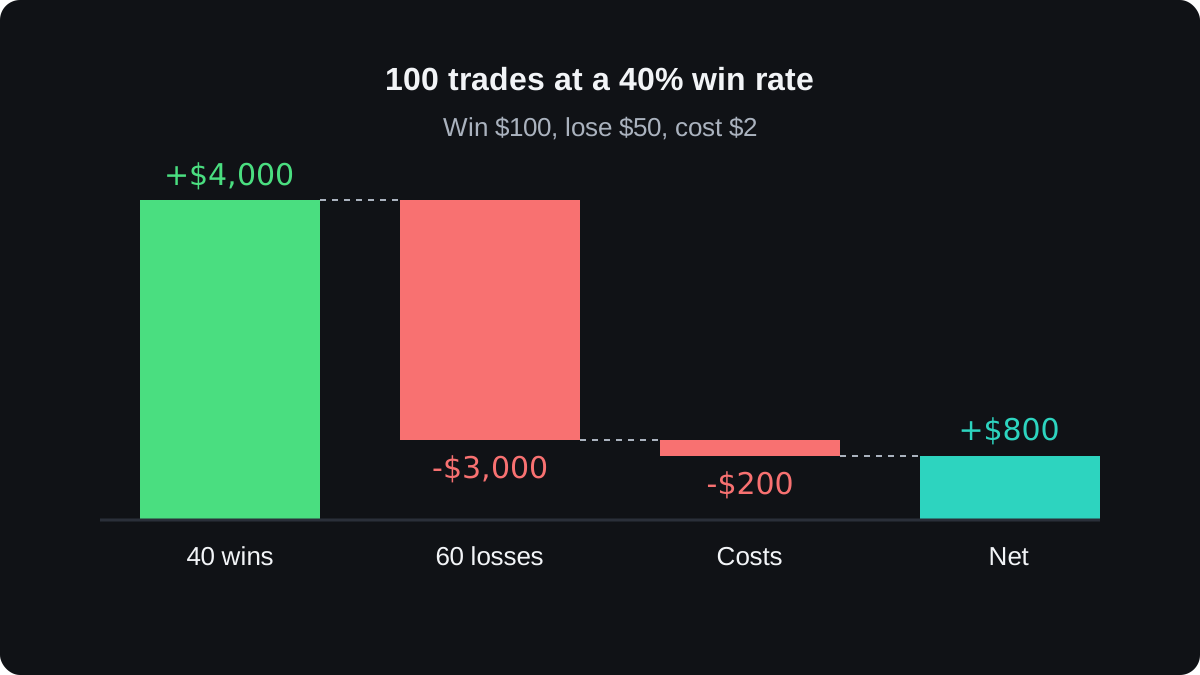
This system lost more often than it won and still finished ahead, because each win was twice the size of each loss. The risk-reward lesson looks at that balance in more detail.
The numbers here were chosen to show the arithmetic. A real system's win rate and average trade come from testing, and they can drift when the market starts behaving differently.
Good test results describe the past and do not promise the future.
Losing runs happen even when the totals are positive. At a 60% loss rate, the chance that five particular trades in a row all lose is 0.6 to the power of 5, about 7.8%, if each trade is independent.
Five losses at $50 is $250, or 5% of the $5,000 account. A system only helps if you keep following it through runs like that.
More rules do not make a system safer. Rules added one by one to fit past charts can match old data by chance and then fail on new prices, a problem called overfitting.
How to build and test your own
The remaining lessons in this module follow the order you would use in practice:
- Write the rules on one page, specific enough that someone else could follow them. Building your entry and exit rules covers this step.
- Check the rules against past charts with backtesting.
- Run them in real time on a demo account, as described in forward testing on demo.
- Record every trade, so you can tell whether you broke the rules or the rules themselves failed.
That last split matters when results disappoint. Fixing your discipline and fixing your rules are different jobs, and a written record of rules and trades is what lets you tell them apart.
Câu hỏi thường gặp
Is a trading system the same as a trading plan?
No. A trading system is the set of rules for individual trades. A trading plan is wider and holds your system plus your goals, schedule, overall risk limits and review routine.
Do I need to know how to code to use a trading system?
No. A written list of rules that you follow by hand is a trading system. Coding helps only if you want to automate a mechanical system or test it quickly on years of data.
Can a trading system guarantee profits?
No. A system makes your decisions consistent and measurable, but its results depend on how the market behaves, and that can change. A system with good test results can still have losing months.
How many rules should a trading system have?
Enough to answer every decision, and few enough to follow without hesitation. Each extra rule tuned to past charts raises the risk that the system fits old data by chance.
Is an expert advisor a trading system?
An expert advisor (EA) is a program that places trades automatically in MetaTrader. It is a mechanical trading system written in code, with the same strengths and limits as the rules inside it.
Học tiếp
 Chương 3Building your entry and exit rules.Entry and exit rules are precise when two people reading them would take the same trade at the same price. Each rule names a timeframe, a price type, a number and an order type. A complete set covers the filter, trigger, entry, stop, target, position size and a time limit, plus what to do in awkward cases.
 Chương 3How to backtest a strategy.Backtesting means applying fixed entry and exit rules to past price data, one candle at a time, and recording every trade the rules would have taken, including costs. The result shows how the rules behaved in the past, with their win rate and worst drawdown. It cannot prove future profits, and errors like look-ahead bias inflate it.
 Chương 3Forward testing on a demo account.Forward testing means running a trading system on live prices as they arrive, usually on a demo account, before you risk real money. It checks whether backtest results survive real spreads, slippage, missed signals and your own discipline. Use the same rules, account size and lot sizing you plan to use live, and record every trade.

